
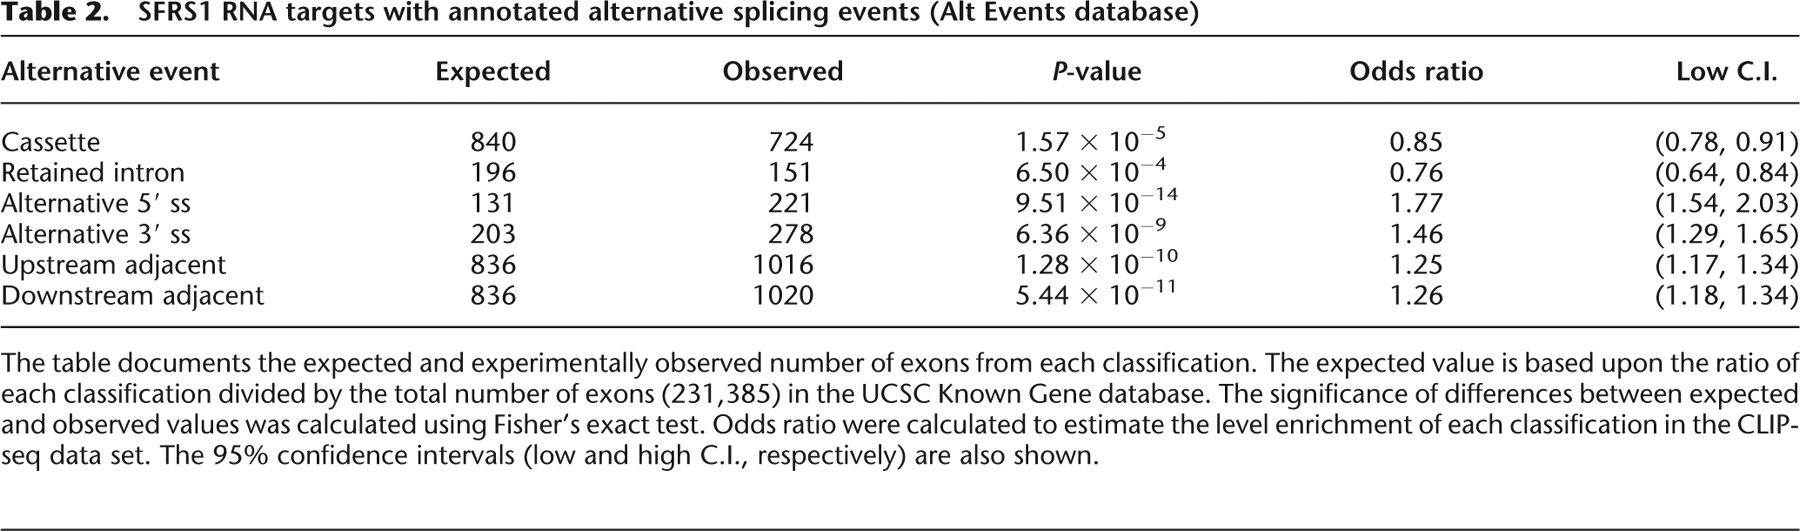
SFRS1 RNA targets with annotated alternative splicing events (Alt Events database)
Click on table to view larger version.
-
The table documents the expected and experimentally observed number of exons from each classification. The expected value is based upon the ratio of each classification divided by the total number of exons (231,385) in the UCSC Known Gene database. The significance of differences between expected and observed values was calculated using Fisher's exact test. Odds ratio were calculated to estimate the level enrichment of each classification in the CLIP-seq data set. The 95% confidence intervals (low and high C.I., respectively) are also shown.


