
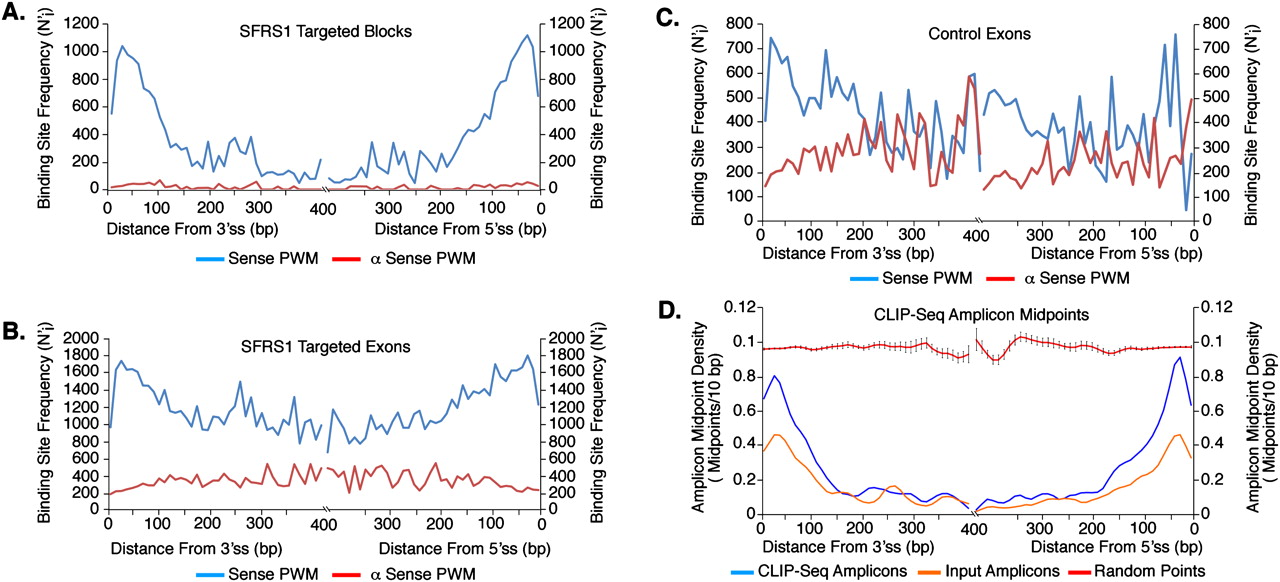
SFRS1 binding sites are enriched at fixed positions relative to splice sites. The adjusted frequency of SFRS1 consensus sites within 10-bp bins (N′) at a specific position relative to splice sites (i) was calculated by multiplying the number of consensus sites observed by the total number of exons divided by exon ≥2i in length. In A–C, the blue and red lines represent the sense or antisense PWMs, respectively. (A) Positions of SFRS1 binding sites within sequence blocks identified by CLIP-seq. (B) Positions of SFRS1 binding sites across full-length exons targeted by SFRS1. (C) Positions of SFRS1 binding sites across randomly selected exons from the human genome. (D) The distance from splice sites to the midpoints of CLIP-seq amplicons was calculated as described above. CLIP-seq and Input Amplicon midpoints (blue and orange lines, respectively) were compared with randomly selected “points” picked from exons selected at random from the genome (red lines). This comparison demonstrated that the amplicons identified by CLIP were enriched relative to the input samples at the boundaries of exons. Likewise, randomly selected “points” differ dramatically with respect to the experimentally observed amplicon midpoints.


