
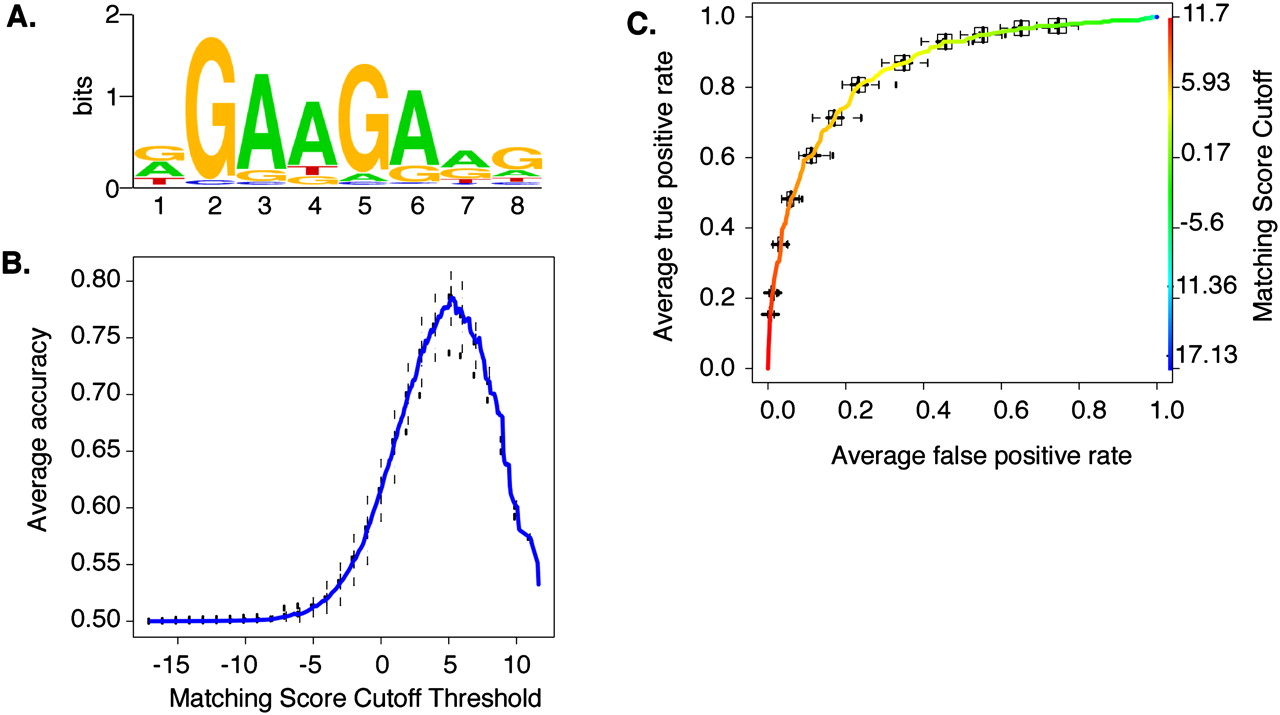
Modeling the in situ SFRS1 consensus-binding motif. (A) The MEME algorithm was used to identify a consensus motif from 300 amplicons selected at random from a total of 641 blocks common to three out of four CLIP-seq experiments. This calculation was repeated 20 times. The motif with the highest sensitivity and specificity (see C) is depicted here. The likelihood of finding this motif at random is <1 × 10−107. (B) The averaged Accuracy plot for each positional weight matrix calculated from the MEME results. The prediction accuracy of the SFRS1 site was plotted as a function of matching score cutoff threshold. Maximum accuracy (78%) was achieved at a cutoff score of 5.2. This calculation was repeated 40 times using the gold standard data set. Error bars correspond to the standard deviation from the mean accuracy. (C) The averaged receiver operator characteristic curve of the SFRS1 consensus site model. This plot evaluates the sensitivity (true positive rate of discovery) and specificity (false positive discovery rate) as functions of matching score cutoff threshold. The ROC evaluates the ability of the PWM to discriminate between positive (CLIP-seq derived) and negative components (55-bp fragments selected from intergenic deserts) of the gold standard data set. This calculation was repeated 40 times. Error bars correspond to standard deviation from the mean sensitivity and specificity.


