
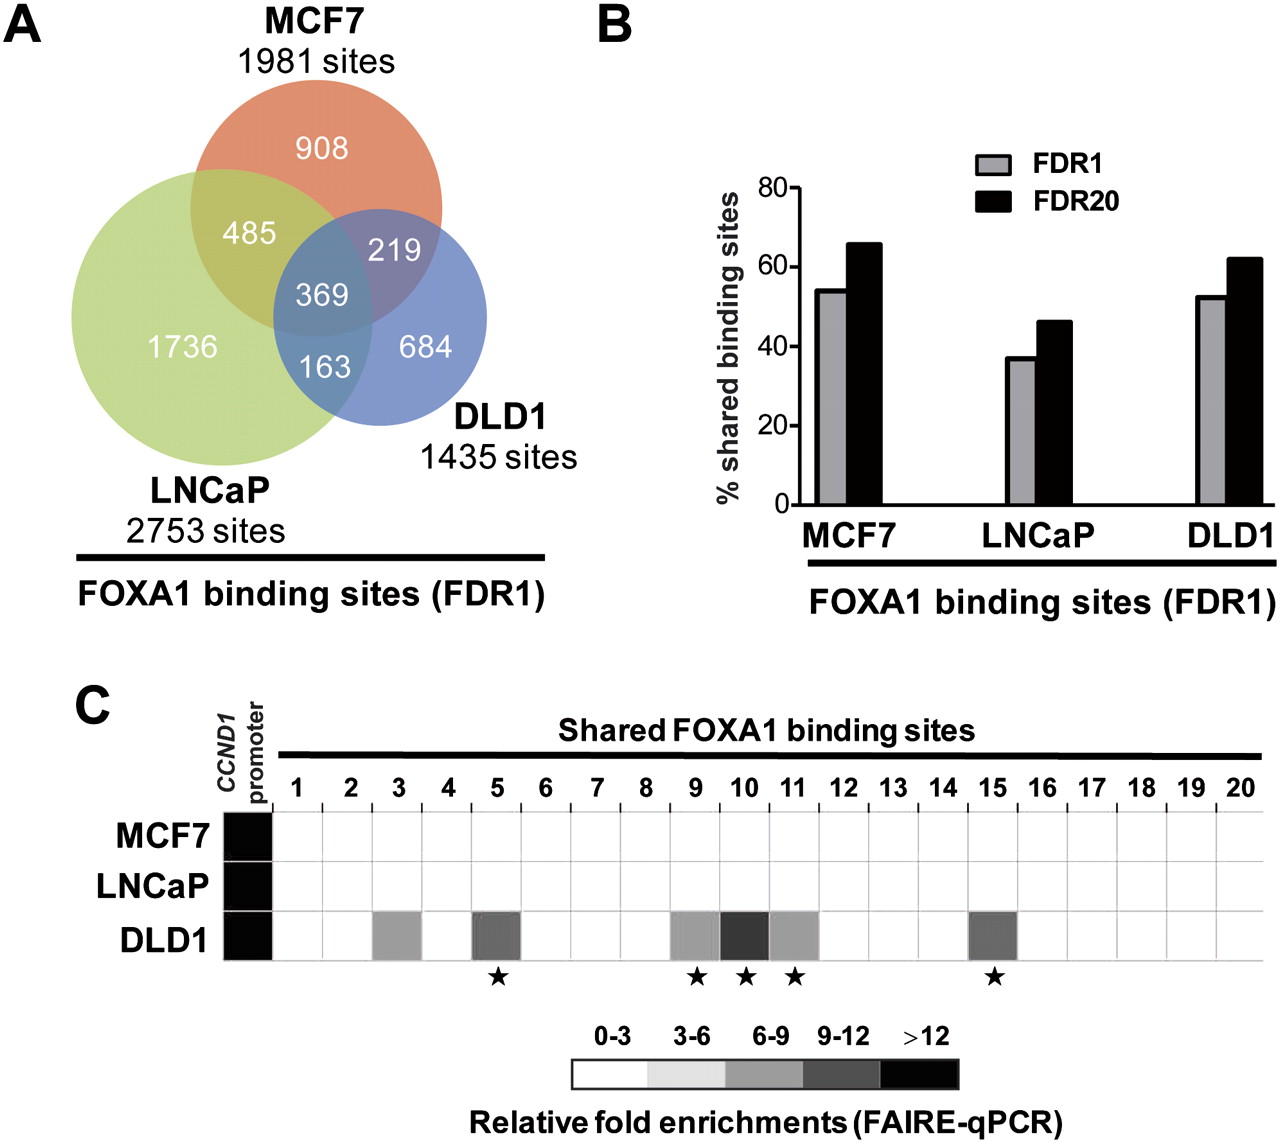
Comparison of FOXA1 recruitment sites within MCF7, LNCaP, and DLD1 cells. (A) Venn diagram showing the overlap between FOXA1 recruitment sites identified in three different cell lineages, i.e., breast (MCF7), prostate (LNCaP), and colon (DLD1) cells. Only high confidence binding sites were used here (FDR1). (B) Histogram showing the percentage of high confidence FOXA1 binding sites (FDR1) from each cell-line that is also found in at least one of the other two cells at FDR1 or 20. (C) FAIRE-qPCR experiments were performed in MCF7, LNCaP, and DLD1 cells. CCND1 proximal promoter, used as a positive control (Eeckhoute et al. 2006), and 20 FOXA1 binding sites shared between the three cell-lines were analyzed. Relative enrichments compared to negative control regions are shown. Data are mean ± SD from two or three independent experiments. * Indicates statistically significant differences (P < 0.05) between FAIRE enrichments in DLD1 and both MCF7 and LNCaP cells.


