
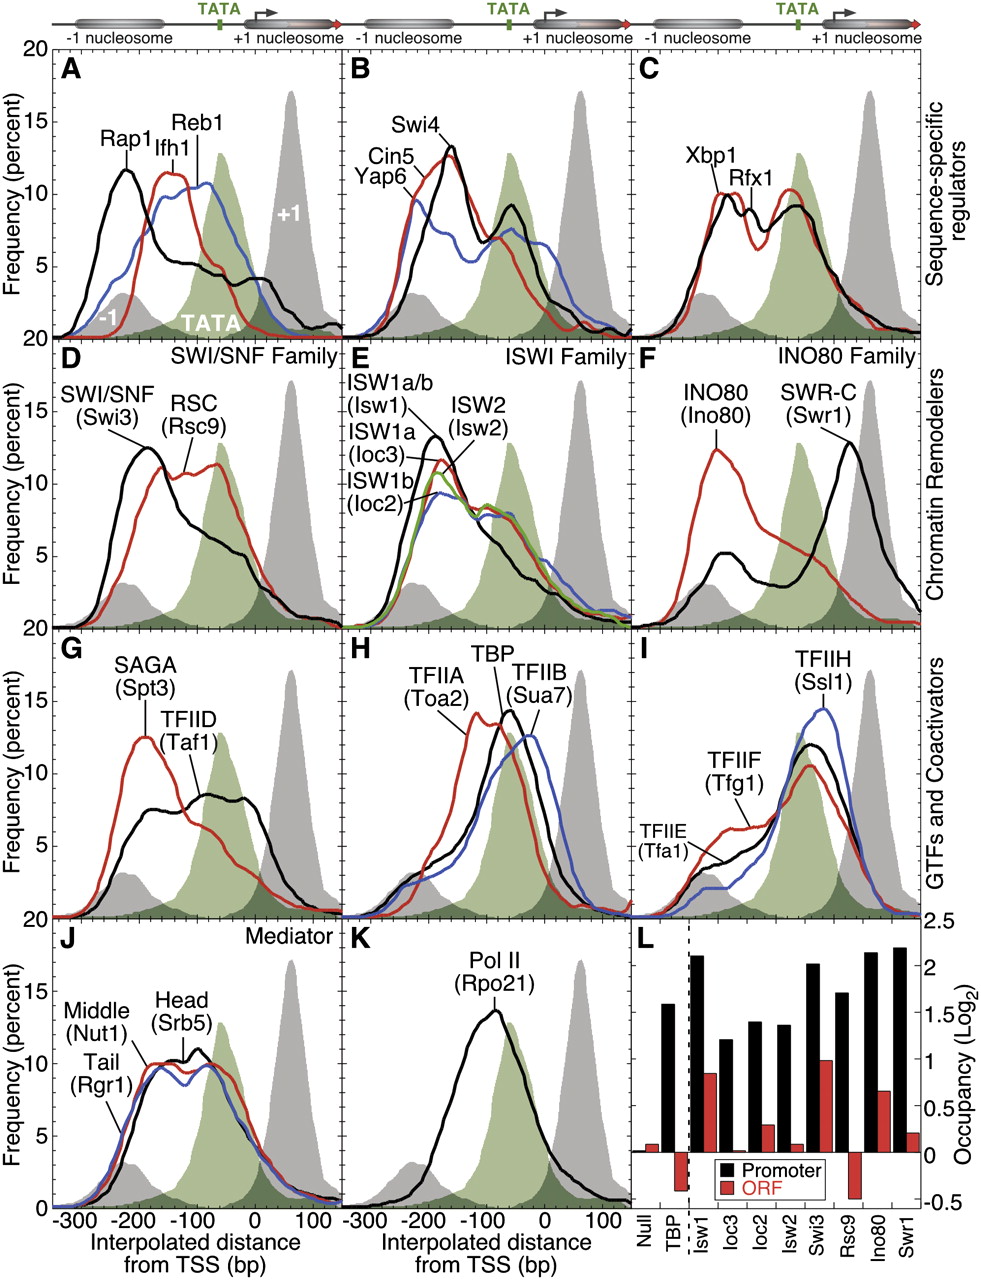
Genome-wide spatial assembly of the transcription machinery in the context of chromatin. (A–K) The composite frequency distributions for the binding locations for components of the transcription machinery are shown for all protein coding genes relative to the TSS (false discovery rates for each factor are reported in Supplemental Table S1). The distribution of TATA boxes when present (green fill) (Basehoar et al. 2004) and H2A.Z promoter nucleosomes (gray fill) (Albert et al. 2007), which are shown in each panel. (L) Occupancy detected toward the 3′ end of each gene (designated ORF) is compared to occupancy in the promoter region. Shown in the bar graph are the median occupancy values for all genes in which occupancy of at least one region (ORF or Promoter) met the 5% FDR cut-off.


