
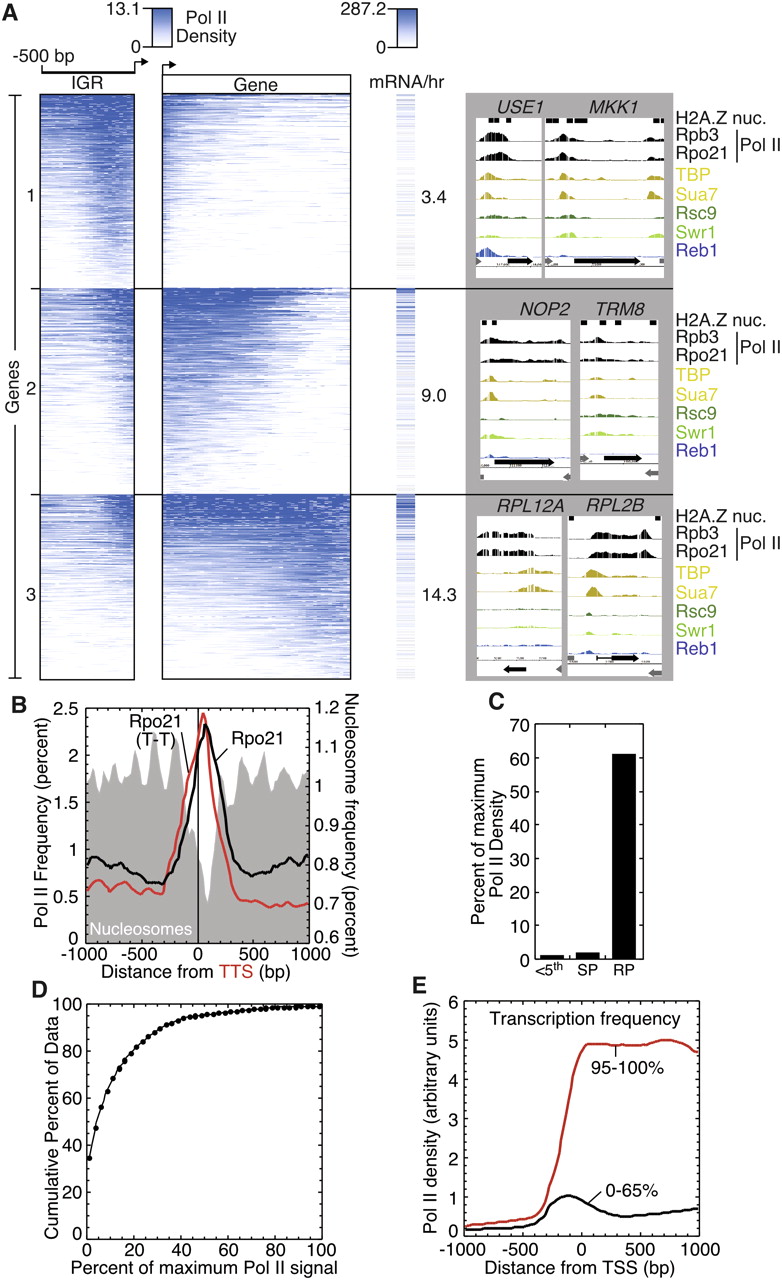
Pol II density across genes. (A) Cluster plot of Pol II density across individual genes. Normalized Pol II (Rpo21) ChIP-chip signal was binned in 20-bp increments for intergenic regions (denoted “IGR”) from the TSS to 500 bp upstream. The same was done for genic regions (denoted Gene) except that the data were parsed into 50 equal sized bins (and thus represents a percentage of the gene length, rather than absolute distance). The normalized signal within each bin was averaged, K-means clustered (k = 4, the fourth group of ∼3000 genes is not shown because very little Pol II was observed in the vicinity of the genes), and displayed using Treeview (Eisen et al. 1998). Pol II enrichment and transcription frequency are shown in blue. The transcription frequency, denoted as mRNA/hr (Holstege et al. 1998), for each gene was aligned to the cluster order and displayed, and the average value for each cluster was reported. Also shown are representative screenshots of the normalized signal distribution for Pol II and other factors at individual genes from groups 1–3. The identity of the genes in groups 1–3 can be found in Supplemental Table S5 (column J). (B) The composite frequency distribution of Pol II (Rpo21) intensity peaks relative to the transcript termination site (TTS) (i.e., the site of polyA addition). All TTS are shown in black, and only those that are downstream from two converging genes are shown in red (designated T-T). The distribution of nucleosomes is shown as a gray fill (Mavrich et al. 2008). (C) Pol II is mostly absent from lowly transcribed genes and abundant at highly transcribed genes. The gene having the highest average Pol II density was identified (RPS3), and set to the maximum level of Pol II occupancy (100 arbitrary units). The average Pol II density for three classes of genes, relative to this maximum was assessed: 311 genes in the lowest fifth percentile of transcription frequency (Holstege et al. 1998), 61 mid-late sporulation genes (SP) (Gasch et al. 2000), and 132 ribosomal protein genes (RPG). For each group of genes, the median percentage value is plotted. (D) Most genes have very little bound Pol II. The percentage of all 5228 protein coding genes (y-axis) that has less than the indicated Pol II level (as a percentage of the level found at RPS3) is plotted. For example, 50% of all genes have <5% of the maximum level of Pol II. The region examined for each gene was from 100 bp upstream of the TSS (or 160 bp upstream of the ORF start, if no TSS was present) to the TTS (or ORF endpoint, if no TTS was present). (E) Highly and lowly expressed genes display distinct Pol II distributions across genes. The average Pol II density throughout genes is plotted for the 311 genes in the upper fifth percentile (denoted 95–100%) and 3208 genes in the lower 65th percentile (denoted 0–65%) of transcription frequency (Holstege et al. 1998).


