
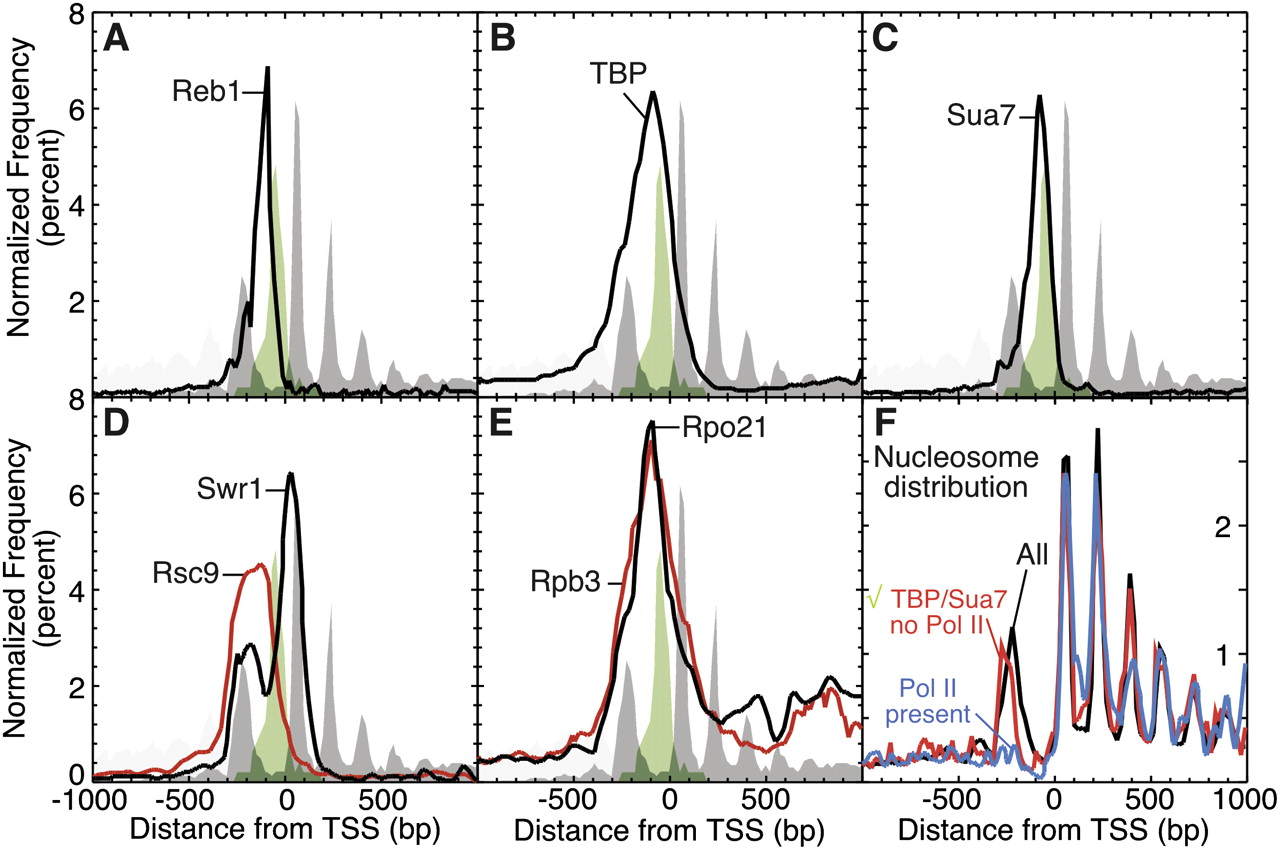
High-resolution map of the organization of the transcription machinery at promoter regions. ChIP-chip on Affymetrix high-density tiling arrays was used to determine the binding location for representative transcription initiation factors. To provide reference landmarks, the genome-wide frequency distributions for H2A.Z nucleosomes determined by ChIP-seq (Albert et al. 2007) and for conserved TATA consensus sites (Basehoar et al. 2004) are shown in gray and green, respectively. (A–E) The composite frequency distributions for the binding locations (peak calls from normalized signal with an FDR <5%) for representative components of the transcription machinery are shown relative to the TSS of protein coding genes. (F) Shown are the composite frequency distributions for the nucleosome sequence reads (Mavrich et al. 2008) for all genes (black trace), for genes containing high levels of Pol II in the promoter region (−500 bp to 100 bp relative to TSS, blue trace), and for genes containing both TBP and TFIIB, but not Pol II, in the promoter region (red trace). The bin counts are expressed as a percentage of the total for each trace over the indicated range so as to compare relative peak heights within traces. Genes that contained high levels of Pol II generally had lower overall levels of nucleosomes.


