
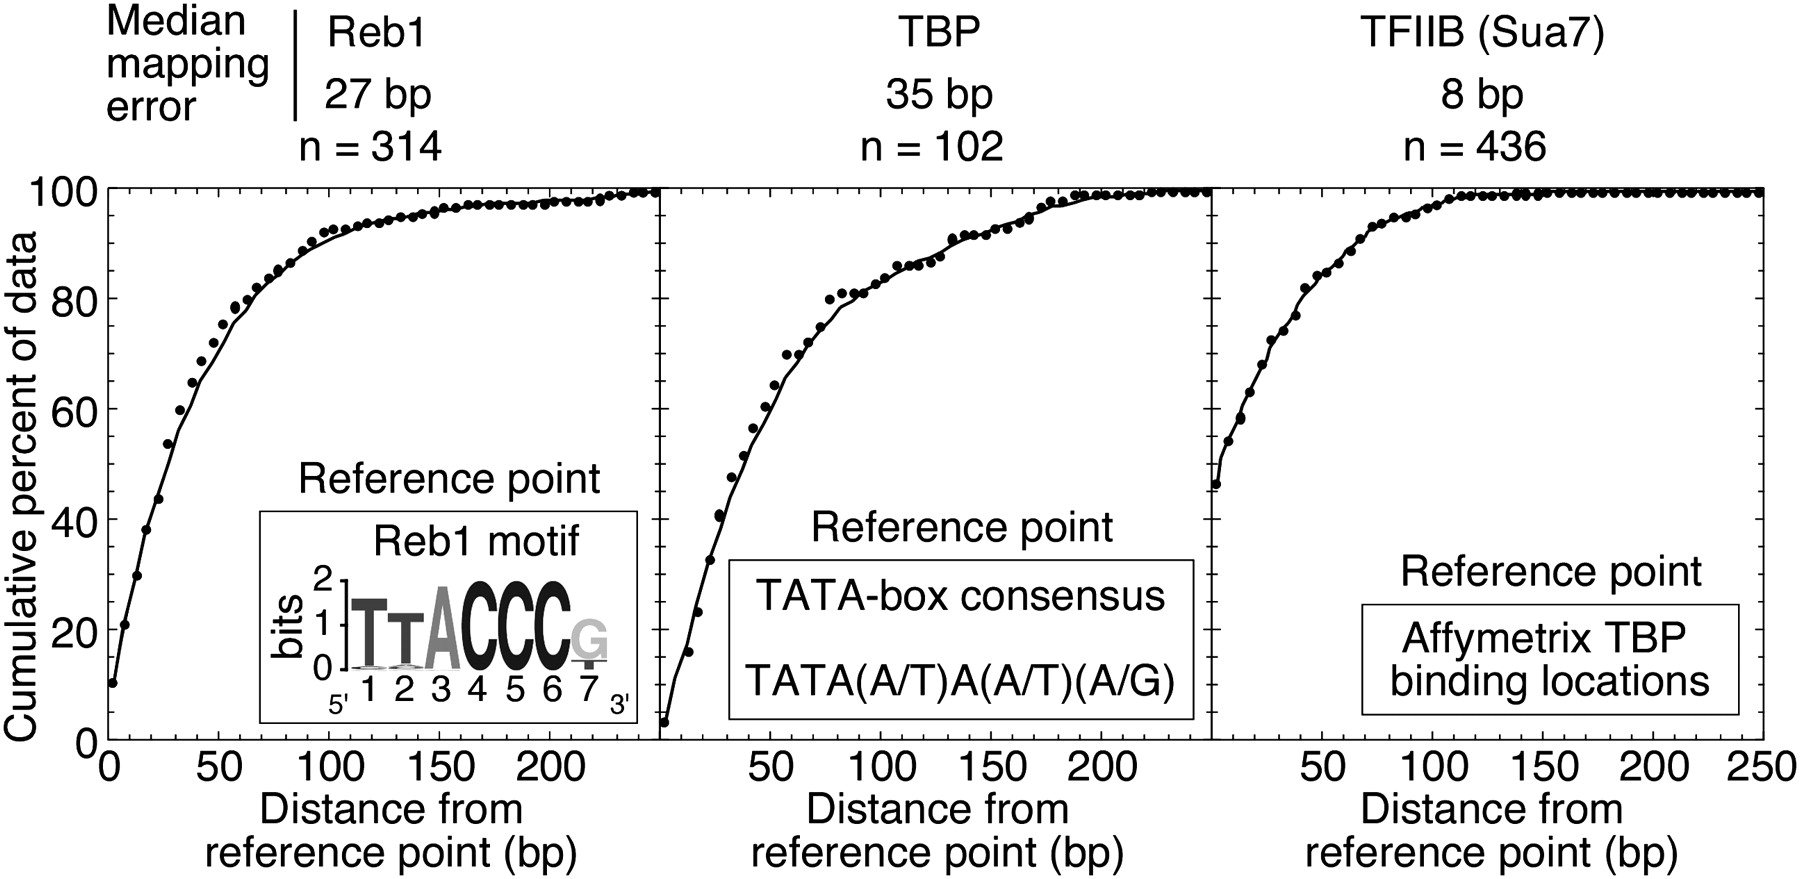
Figure 2.
Error assessment of factor mapping. The cumulative error plots for Reb1, TBP, and Sua7 are shown. Cumulative error is the maximum allowable bp distance between predicted and measured locations. Only data that were within 250 bp of a reference point were considered. The median mapping error and number of data points (n) are indicated above each plot.


