
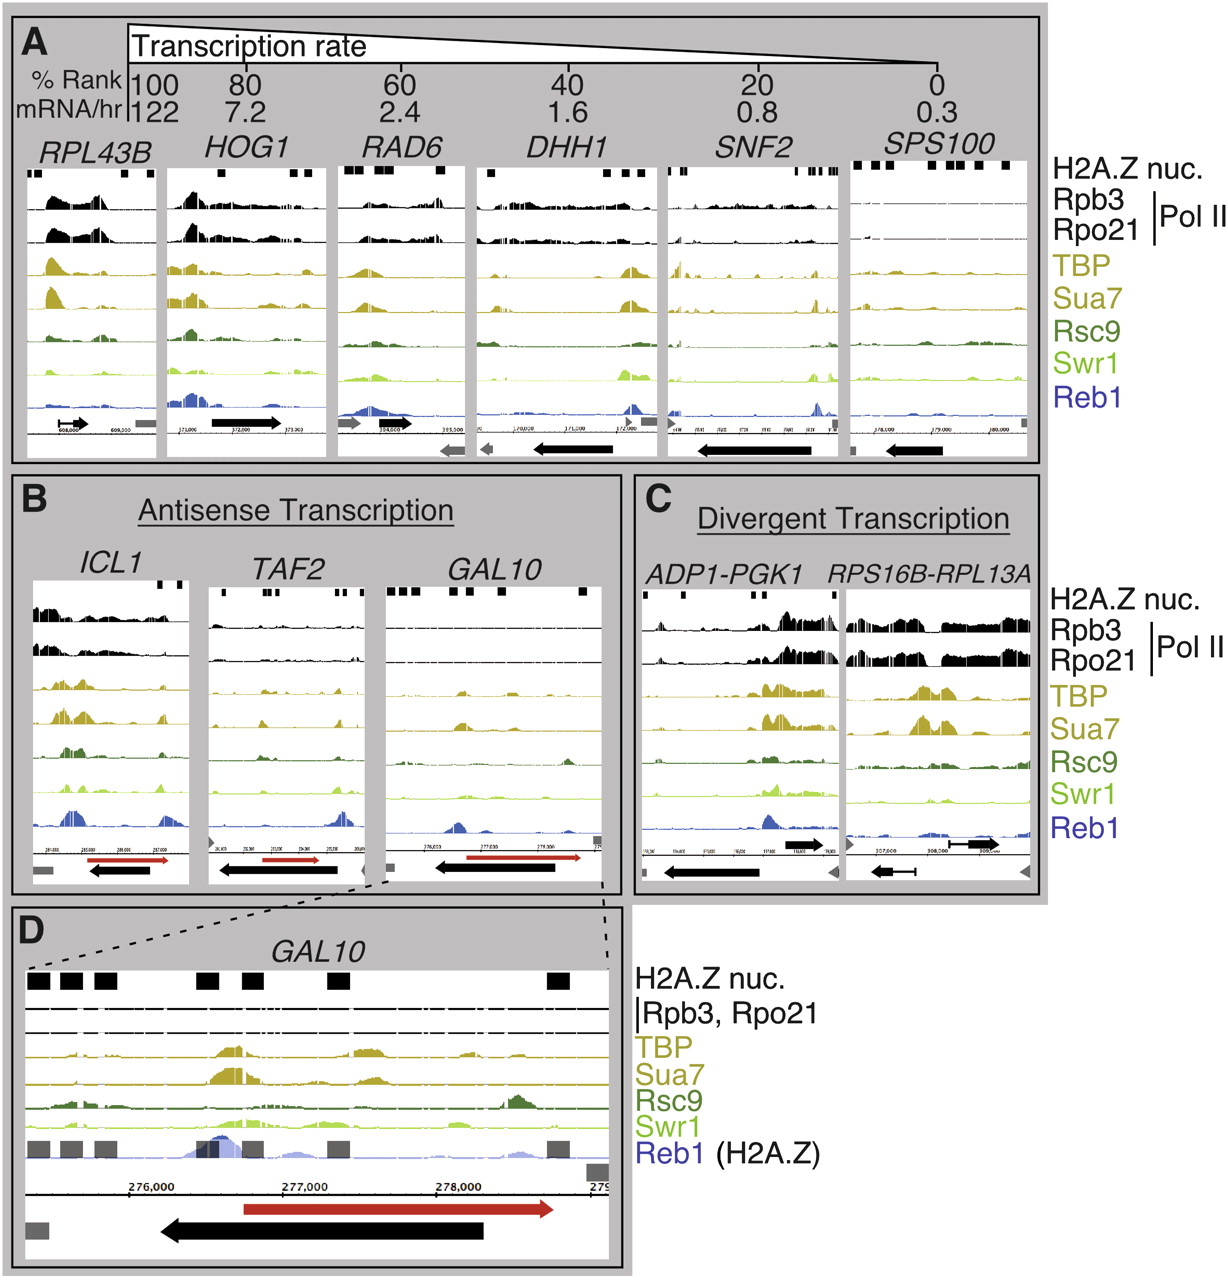
Distribution of transcription factor occupancy at selected genes. ChIP-chip on Affymetrix high-density tiling arrays was performed on representative transcription factors. Each individual bar in the graph represents the normalized signal from a 150-bp sliding window in 5-bp steps for the bound factor indicated to the right of each panel. The locations of H2A.Z-containing nucleosomes are also shown as 147-bp black boxes (Albert et al. 2007). The distribution of factors is anecdotal and should not be interpreted as the consensus location with respect to specific genomic landmarks. (A) Anecdotal example of genes covering a range of transcription frequencies (Holstege et al. 1998), showing a corresponding level of PIC components. (B) Anecdotal example of factor occupancy in regions producing confirmed antisense transcripts (red arrow) (David et al. 2006; Perocchi et al. 2007). (C) Anecdotal example of factor occupancy at divergent, highly transcribed genes. (D) An enlarged view of GAL10. (GAL10 sense transcription is expected to be silent under the glucose-containing media in which this experiment was performed.)


