
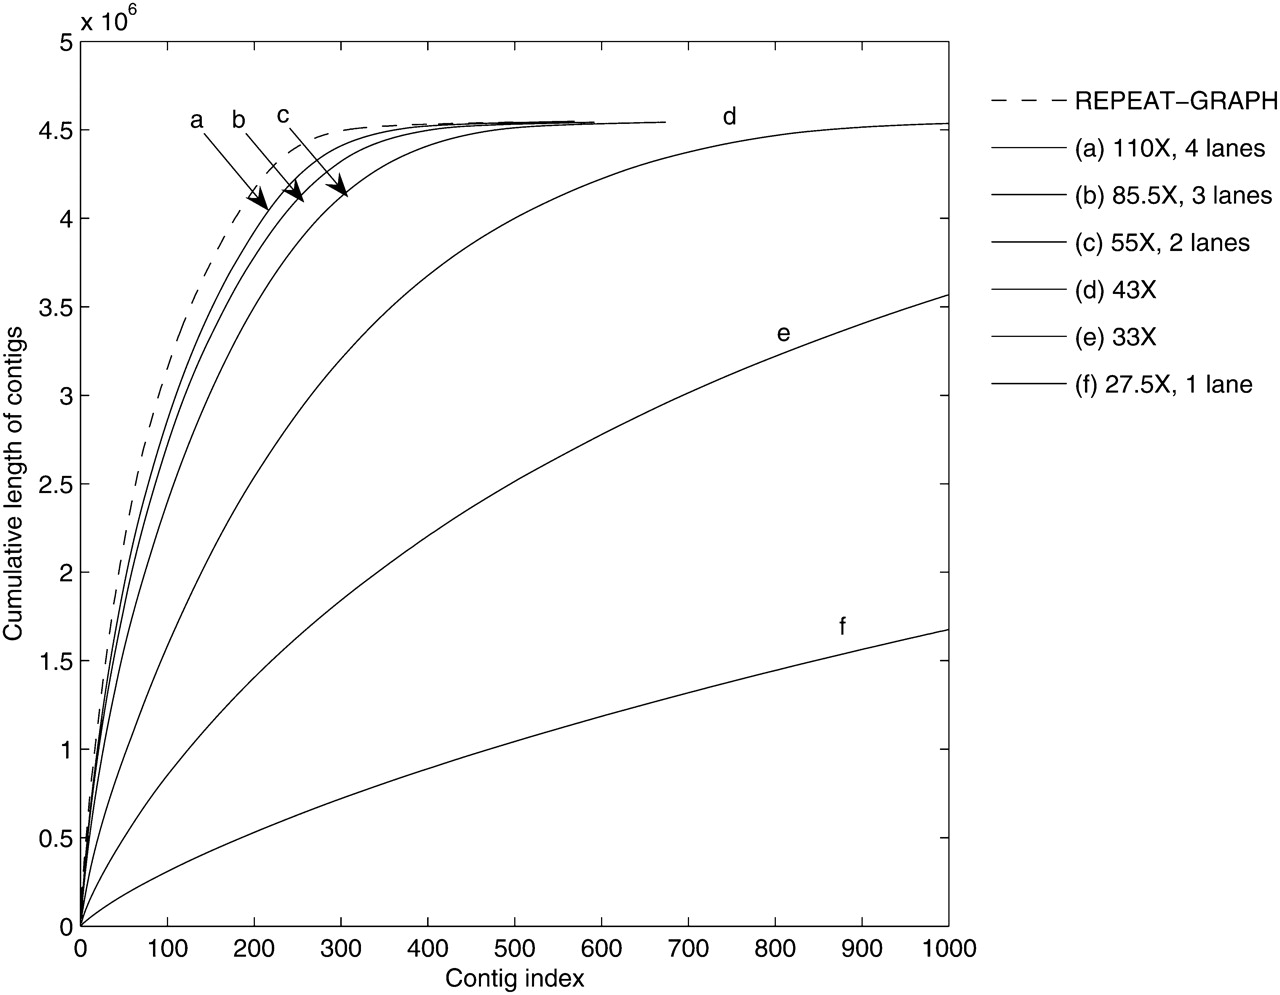
Figure 8.
Statistics of assembly for various read coverage (E. coli genome). The cumulative length of contigs in order of decreasing length is shown for the 1000 longest contigs. The cumulative length of contigs of the repeat graph on the genome is shown as a dashed line.


