
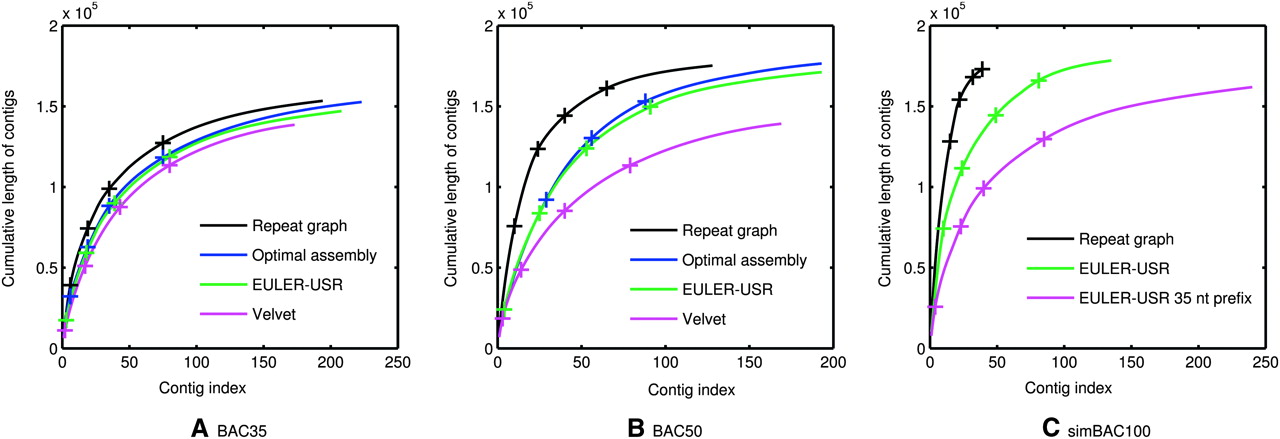
Figure 7.
Comparison of EULER-USR (threading) and Velvet. In each plot, the contigs are ordered in the decreasing order of size and the cumulative size of x longest contigs are shown on the y-axis (only contigs longer than 100 bases are shown). See Table 3 for the choice of parameters of all programs in these plots. For all assemblies of the BAC, the locations of the contigs closest to lengths 5000, 2000, 1000, and 500 bases are shown with a “+” mark.


