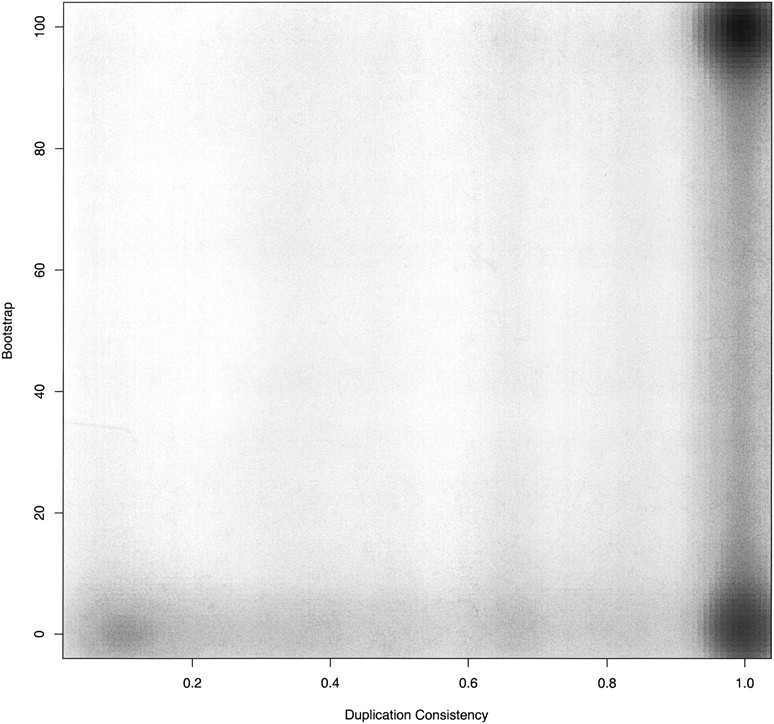
EnsemblCompara GeneTrees: Complete, duplication-aware phylogenetic trees in vertebrates

(Downloading may take up to 30 seconds. If the slide opens in your browser, select File -> Save As to save it.)

Click on image to view larger version.

Figure 3.
Figure 3.

A scatter plot of the duplication consistency score (x-axis) compared to the bootstrap value of duplication nodes (y-axis). Because of the large number of values, the density of points is shown using the smoothScatter kernel-based density function in R.

This Article

  1. Genome Res. 19: 327-335

Preprint Server