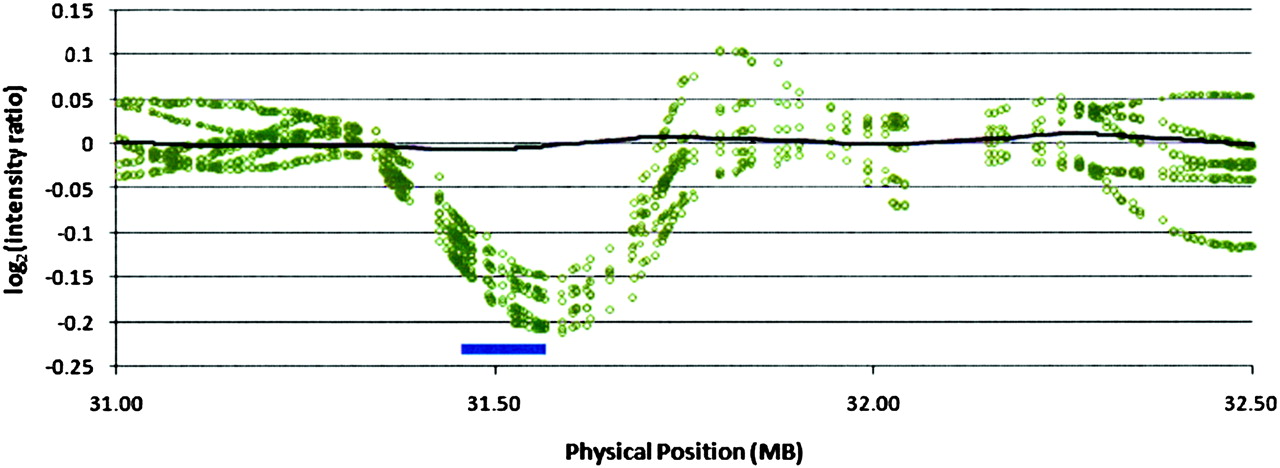
Whole population, genome-wide mapping of hidden relatedness

(Downloading may take up to 30 seconds. If the slide opens in your browser, select File -> Save As to save it.)

Click on image to view larger version.

Figure 3.
Figure 3.

Candidate deletion fluorescence intensity. (Black line) Population average; (open circles) individuals identified as having the deletion; (blue bar at bottom) deletion identified by GERMLINE.

This Article

  1. Genome Res. 19: 318-326

Preprint Server