
Figure 2.
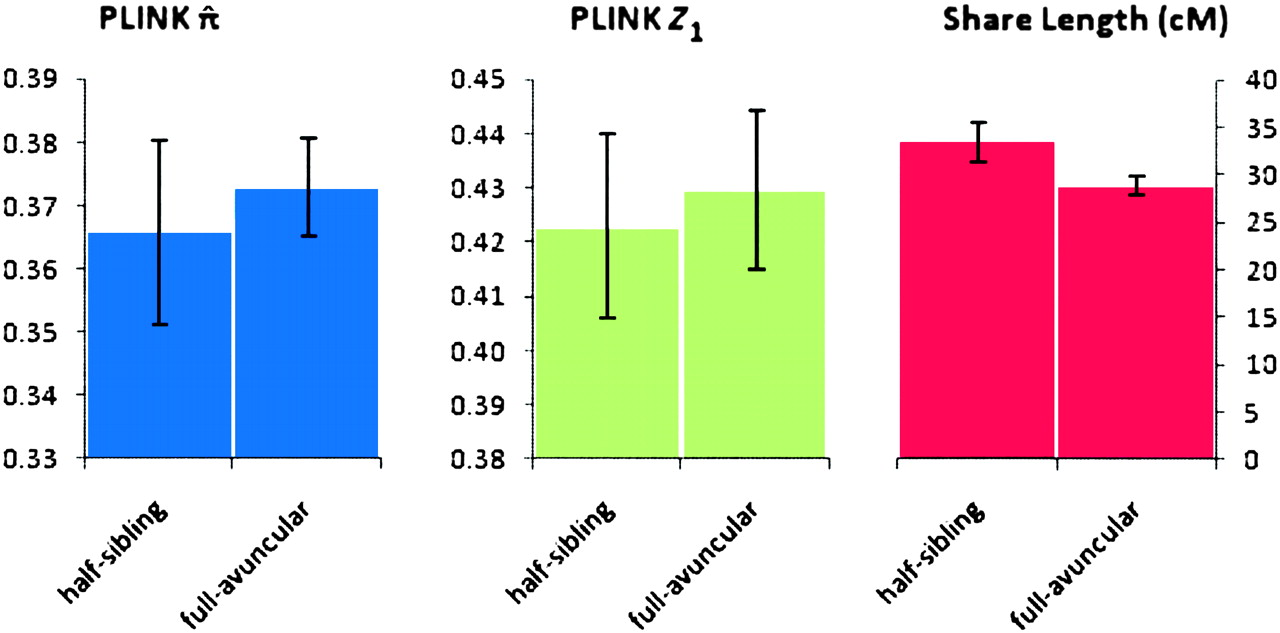
PLINK metrics and share length for equally related pairs. Comparison of PLINK
 and Z1 values with GERMLINE share length for individuals of equal relationship coefficients. (Left) PLINK
 values; (middle) PLINK Z1 values; (right) GERMLINE share length (cM). Error bars, 99% CI.


