
Table 4.
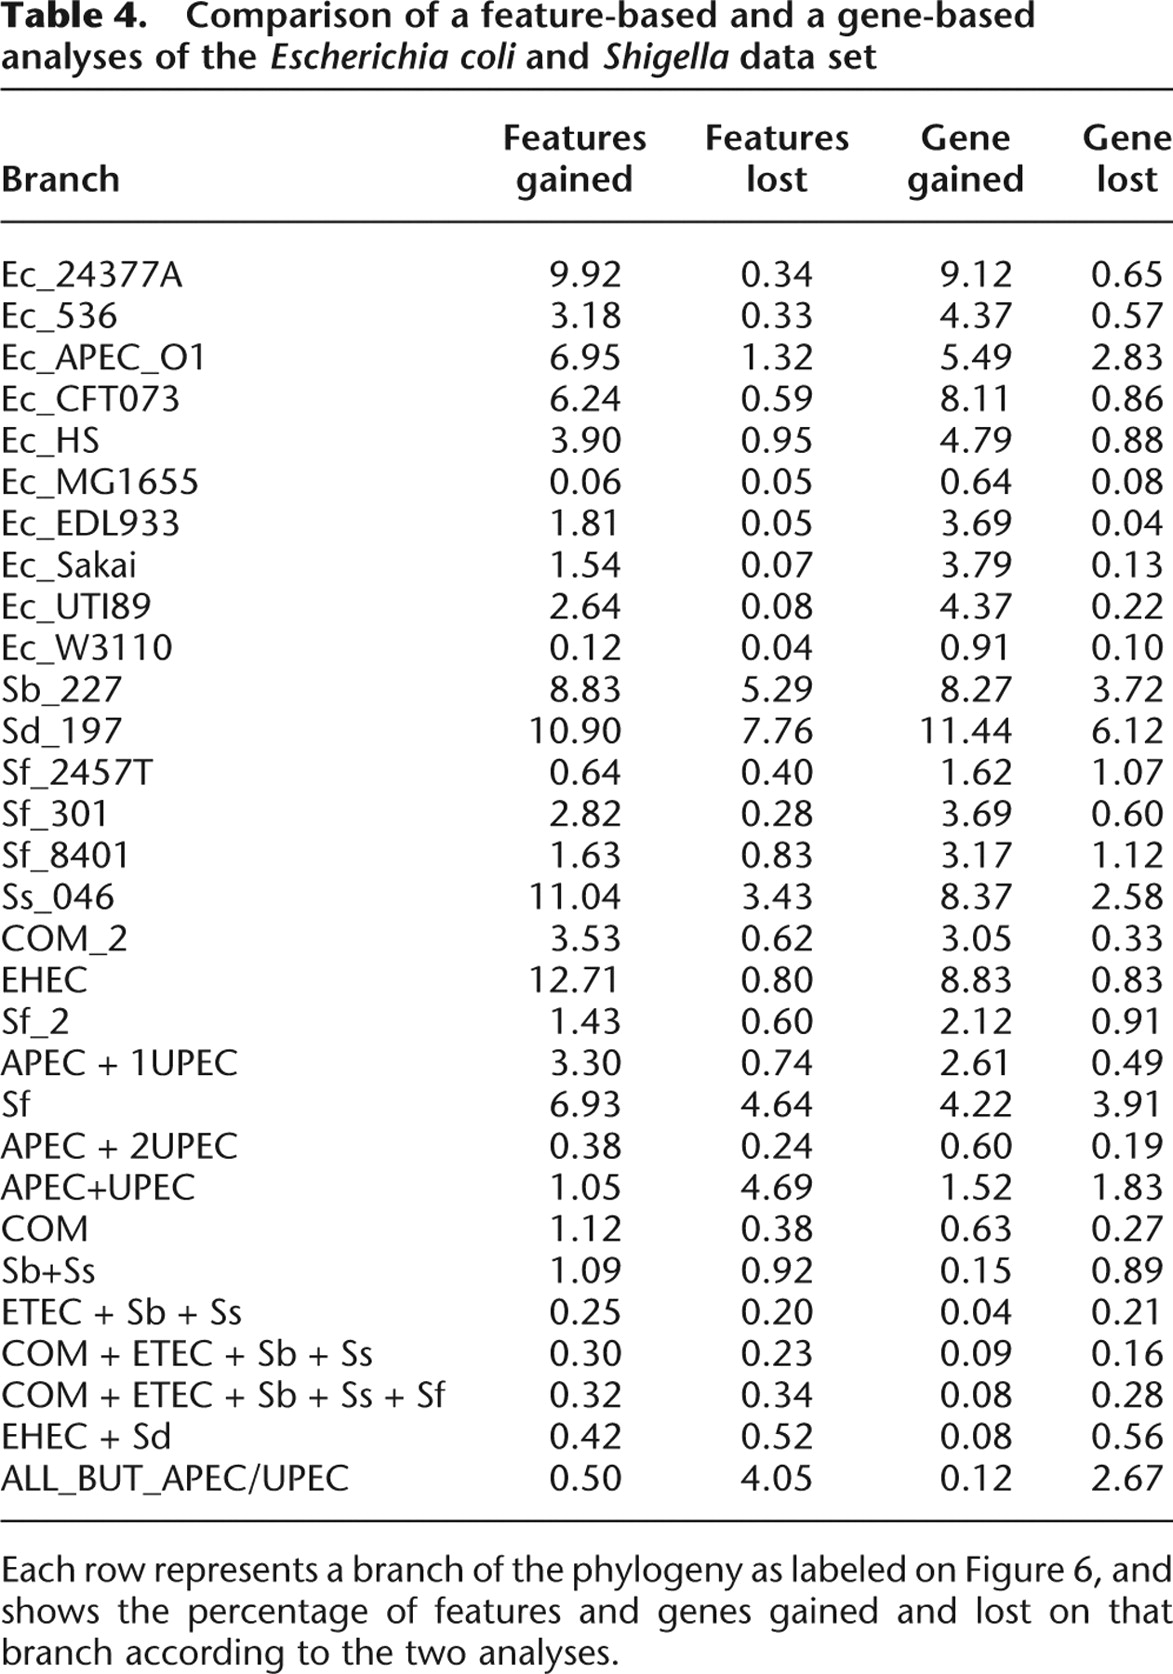
Comparison of a feature-based and a gene-based analyses of the Escherichia coli and Shigella data set
Click on table to view larger version.
-
Each row represents a branch of the phylogeny as labeled on Figure 6, and shows the percentage of features and genes gained and lost on that branch according to the two analyses.


