
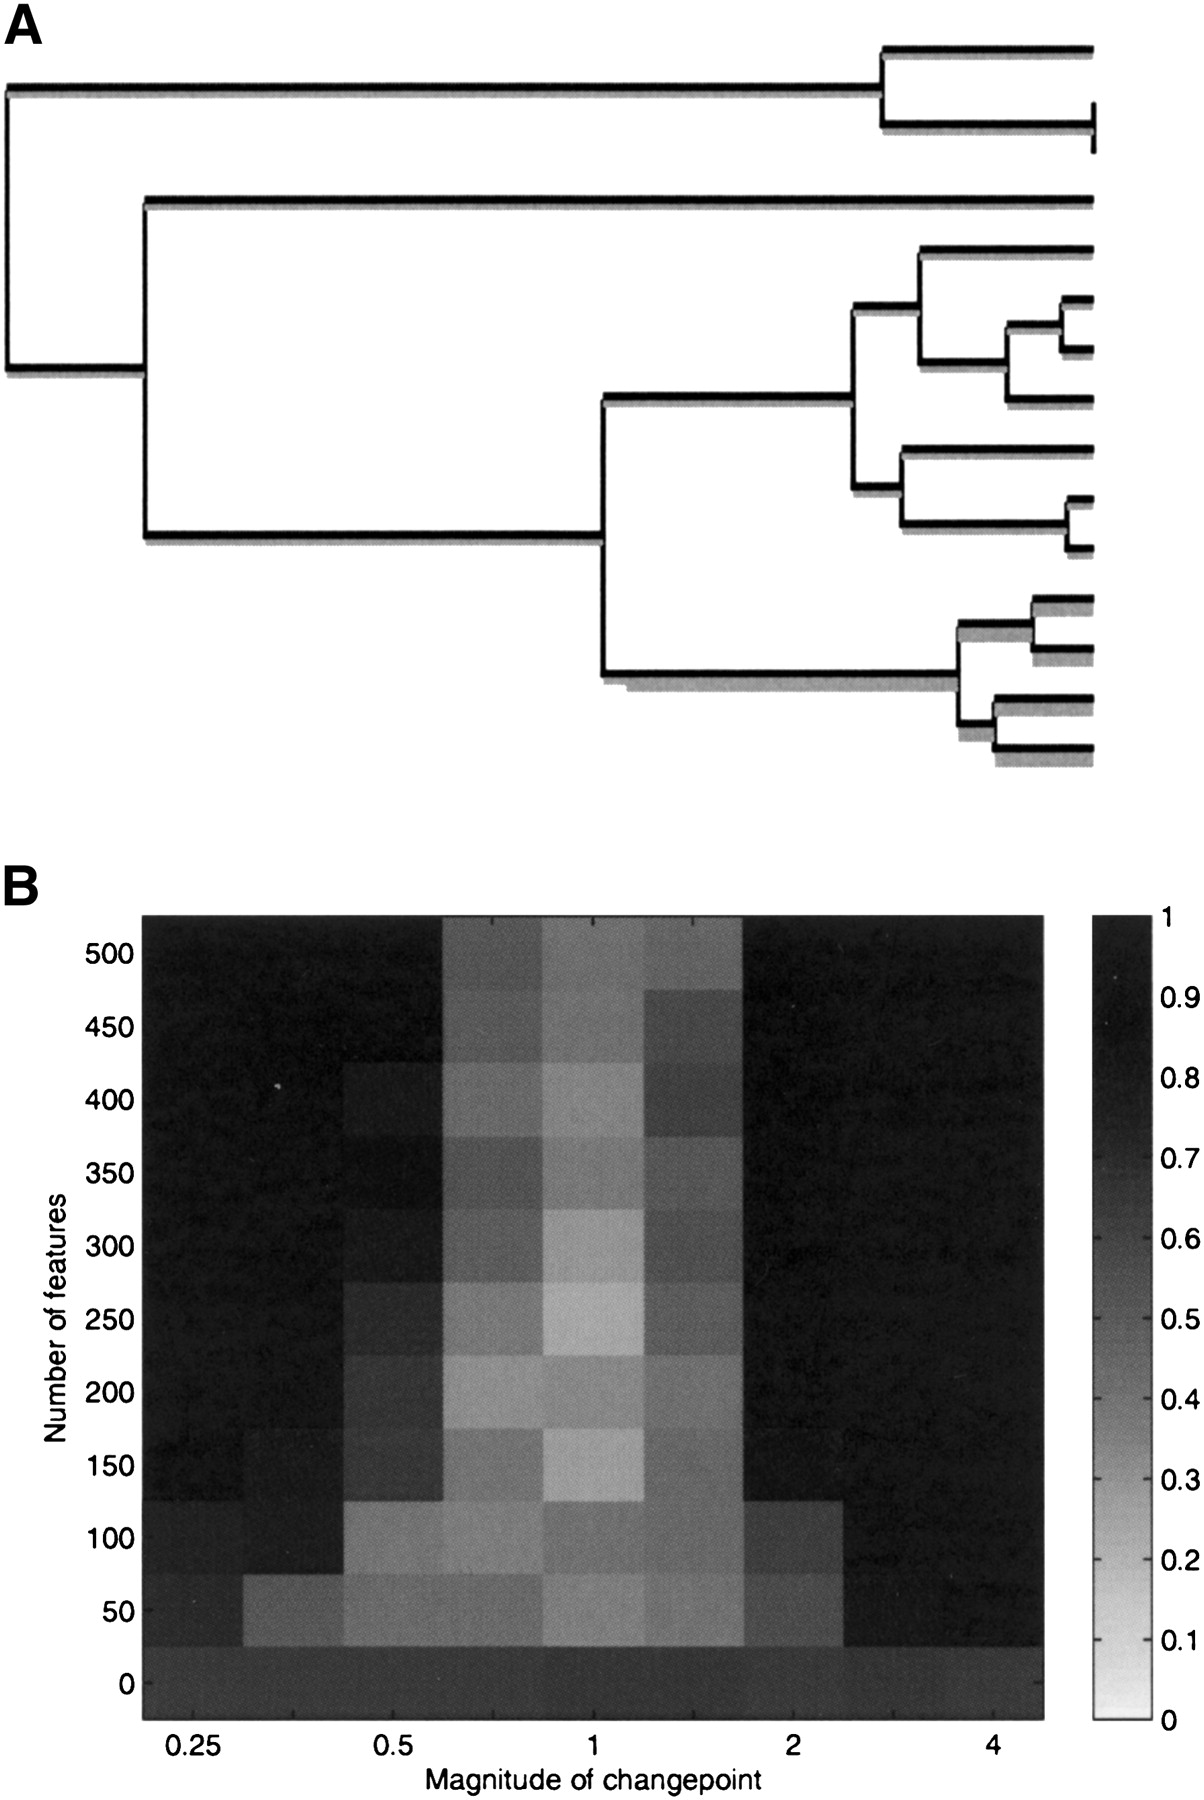
Figure 2.
Simulation study. (A) Coalescent genealogy on which the power study is based, with no changepoint in r− and a single changepoint in r+ on the branch above the last four isolates. (B) Intensity plot of the posterior probability of having exactly one changepoint in r+ on the correct branch, as a function of the number of independent features and the changepoint magnitude.


