
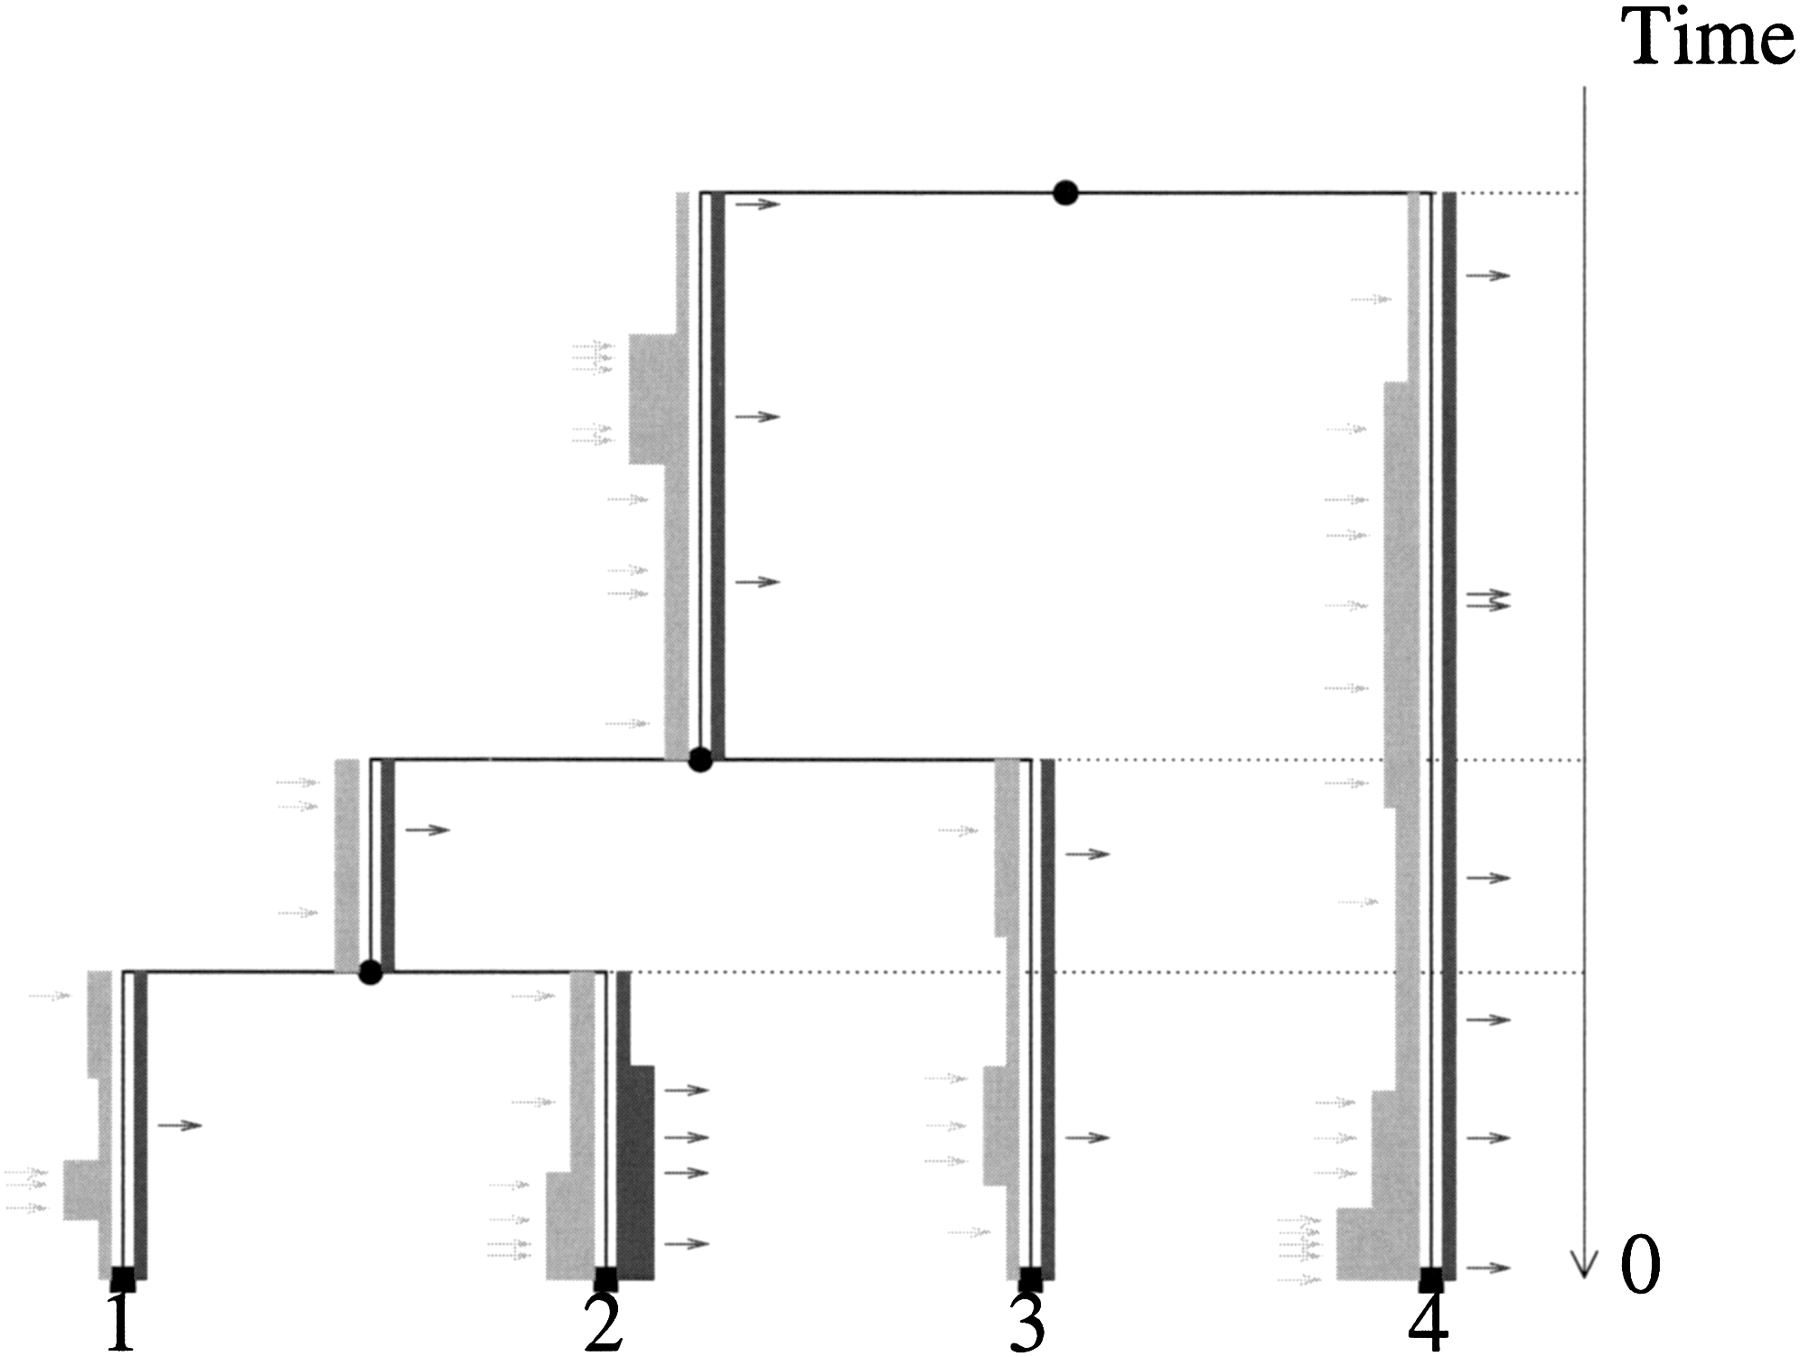
Figure 1.
Illustration of the model. The branches of the phylogeny T are in black. The width of the light gray line on the left of the branches is proportional to the value of r+ (frequency of feature gain). Similarly, the dark gray line on the right of each branch represents r− (frequency of feature loss). Individual feature gain events are represented by light gray arrows, and individual feature loss events are represented by black arrows.


