
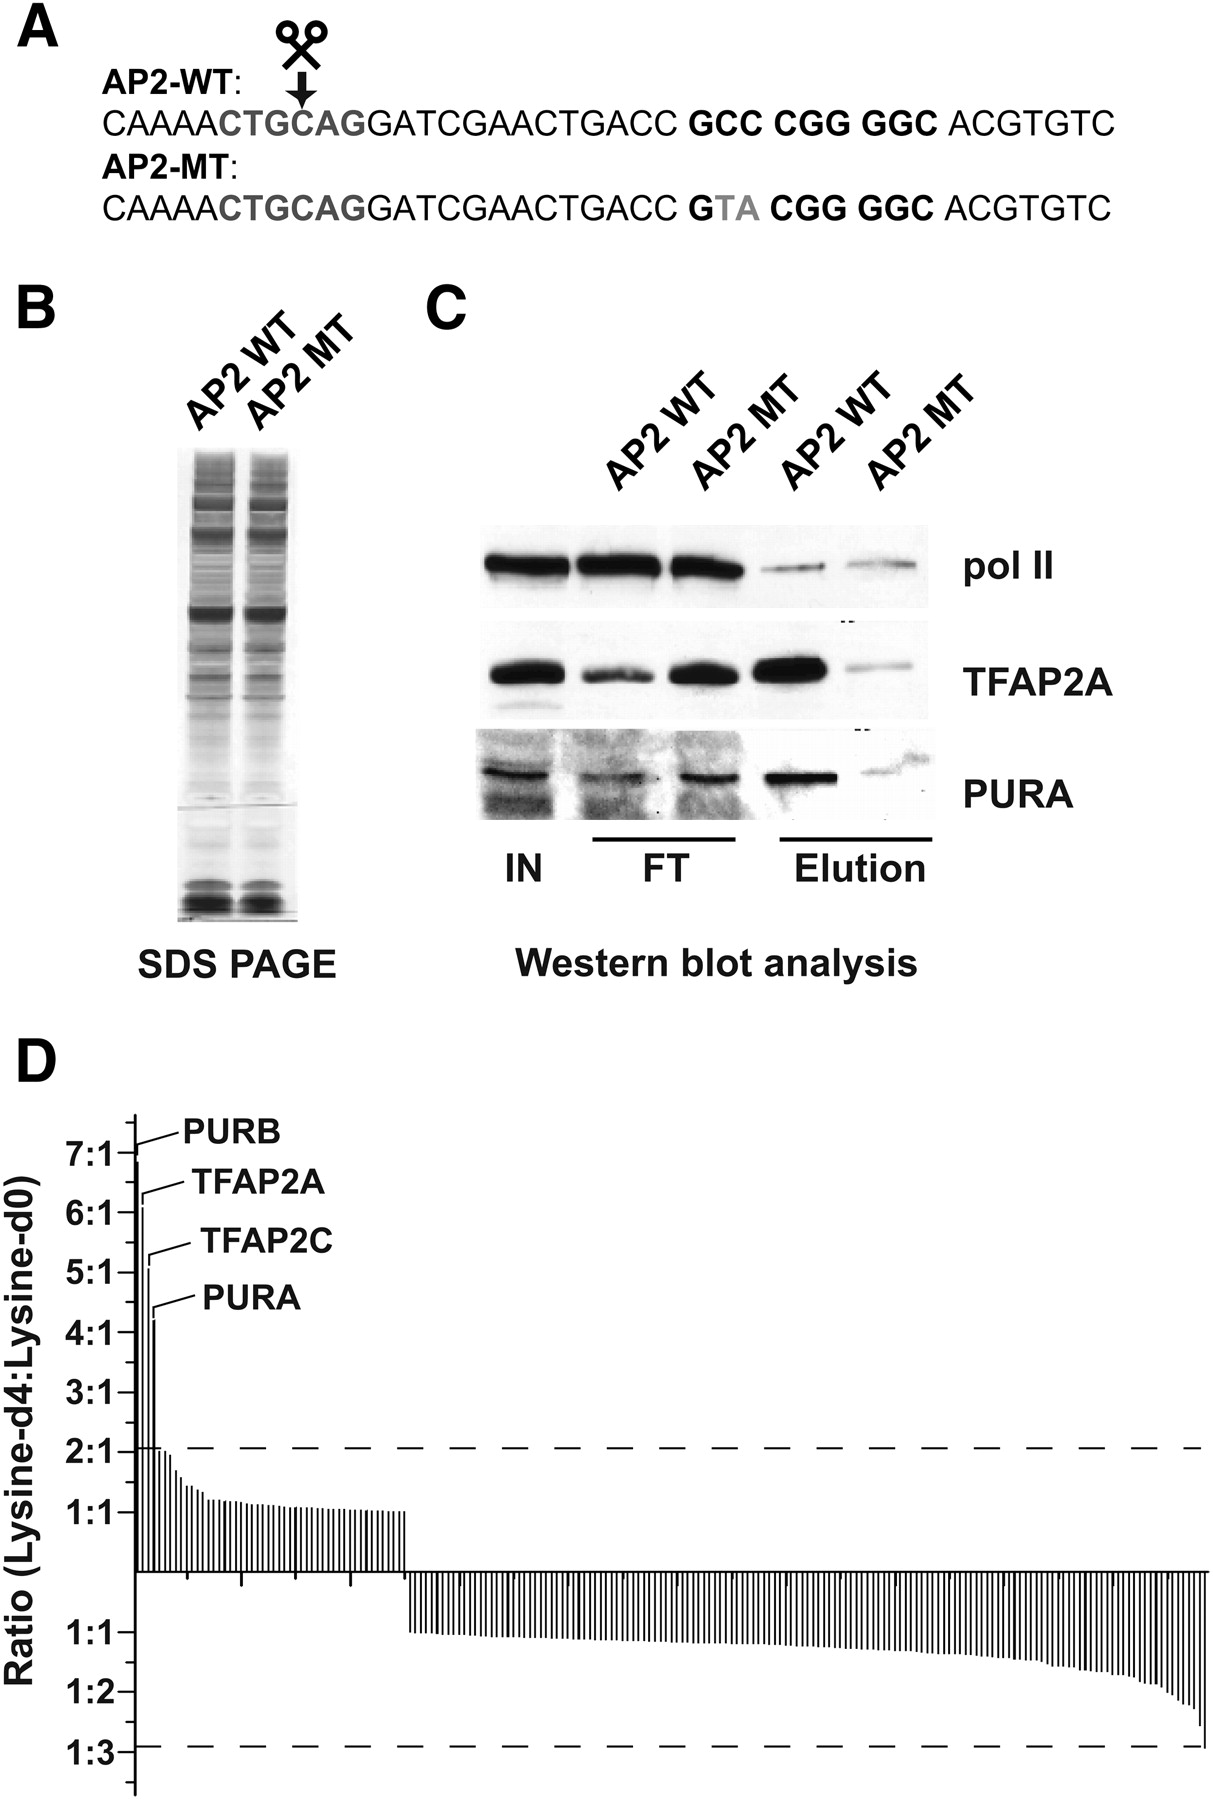
Properties of the DNA–protein interaction screen exemplified by a functional element harboring a binding site for the TF AP2. (A) The sequence of the DNA baits used for the experiment. The AP2 binding site is shown in boldface type, whereas the point mutations designed to disrupt DNA binding are highlighted in gray. (B–D) SILAC is essential for the identification of specific binders. (B) Specific interaction partners cannot be identified by one-dimensional SDS-PAGE and silver staining of the eluted material from the AP2 wild-type (WT) and mutant (MT) columns. (C) Western blot analysis of selected specific interaction partners recapitulates results from the SILAC analysis. Equal amounts (10% of total) of input (IN) and flow-through (FT) as well as eluted (Elution) material (50% of total) from the AP2 wild-type (WT) and mutant (MT) columns, respectively, were analyzed by immunoblotting with antibodies directed against TFAP2A, the POLR2A subunit of RNA polymerase II, and PURA. POLR2A serves as a control for equalized total protein amounts and unspecific binding. (D) SILAC analysis discriminates specific from unspecific binders. Proteins containing peptides with lysine-d4 to lysine-d0 ratios of greater than 3:1 are considered to be specific.


