
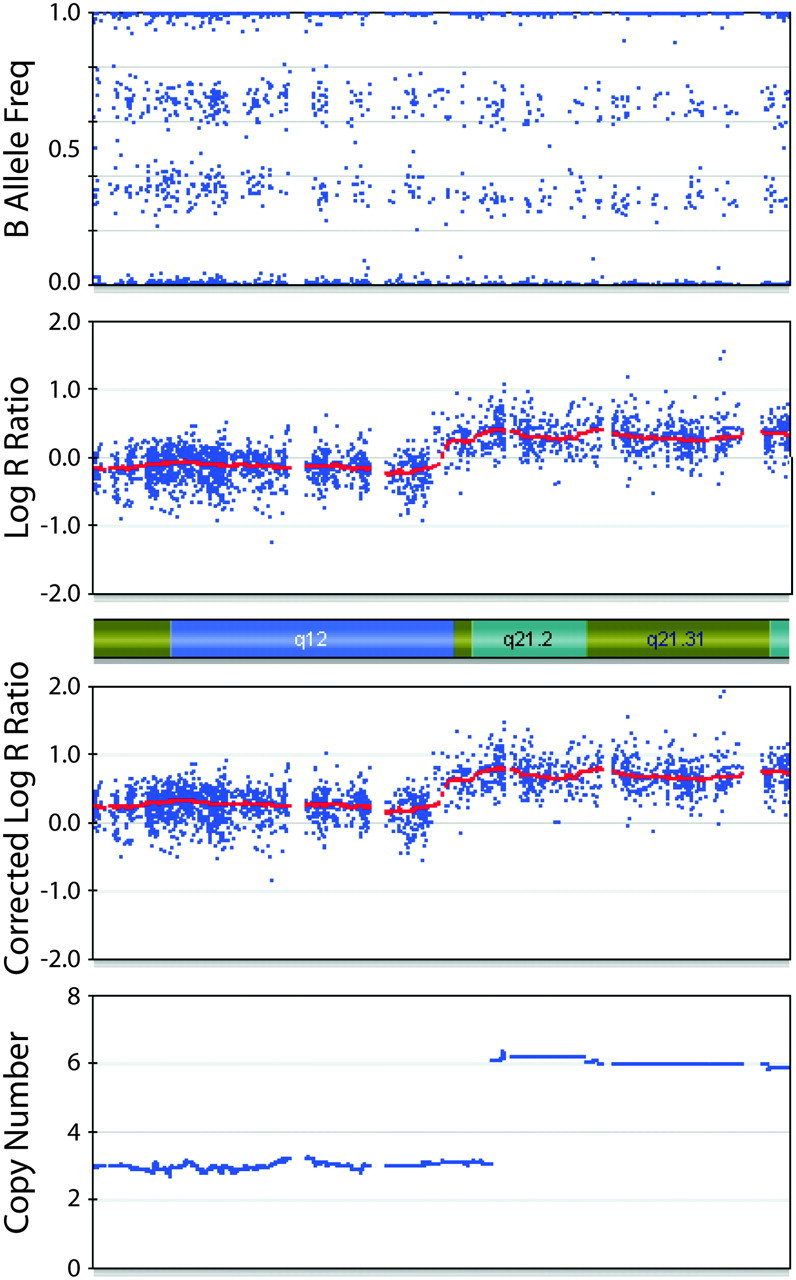
Figure 4.
Corrected LRR and CN of a chromosomal segment from a primary neuroblastoma. The top two plots show BAF and LRR. The third plot shows the LRR after correction for aneuploidy. The change in LRR across the segment indicates a change in CN. The relatively constant BAF of ∼0.33 restricts the possible CNs to multiples of three. After correcting for aneuploidy, the LRR values are most consistent with a region of three copies on the left and a region of six copies on the right. Algorithm output is shown in the bottom plot.


