
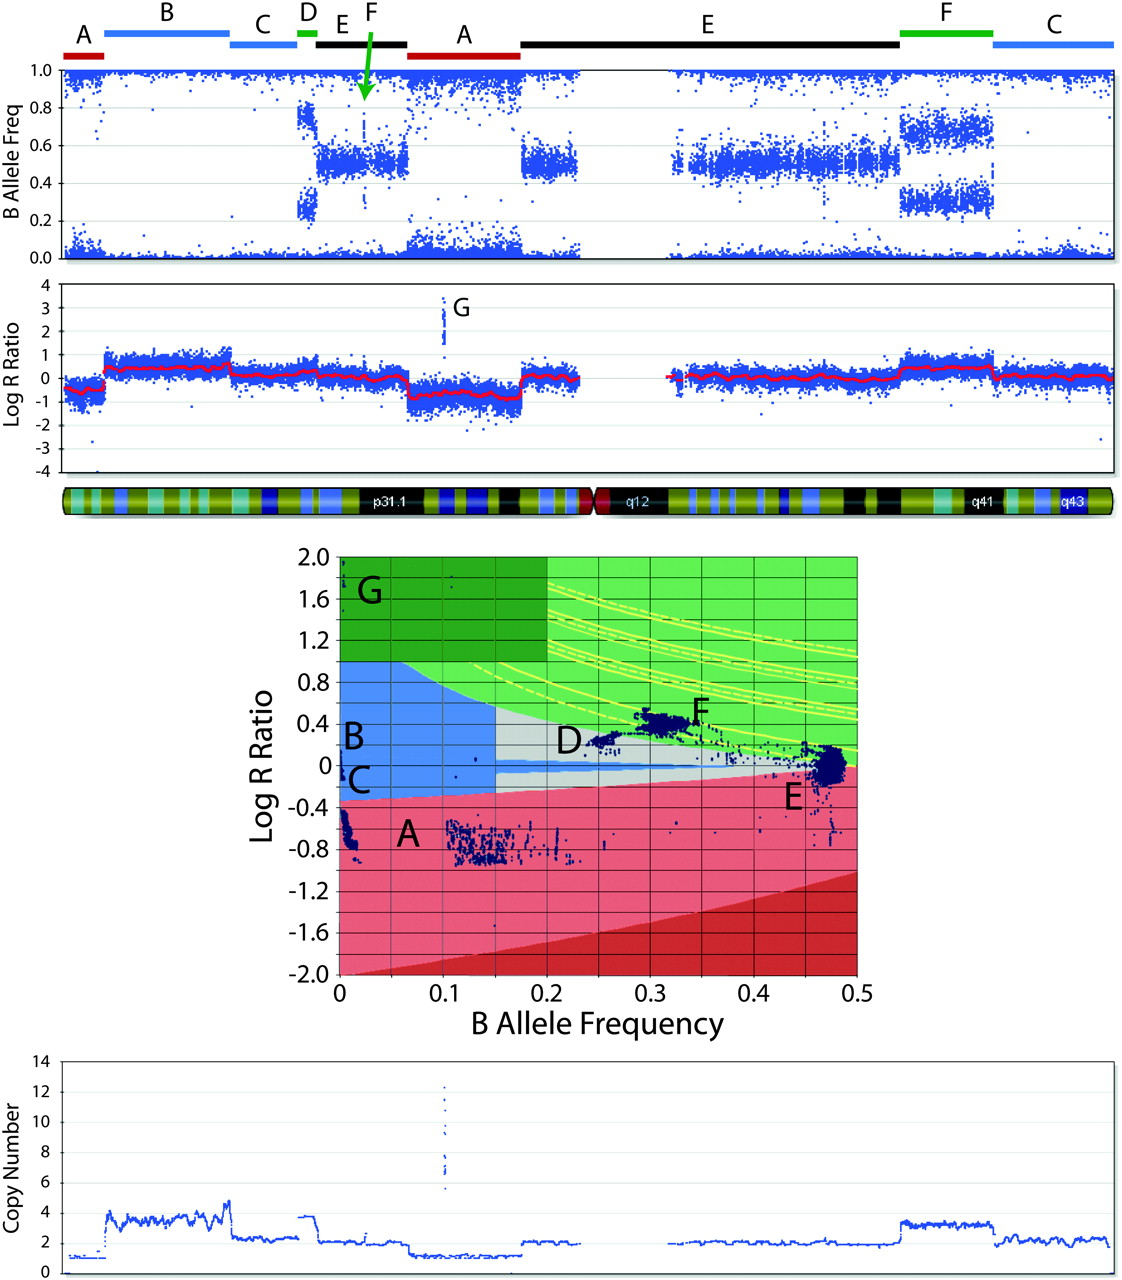
B allele frequency (BAF) and log R ratio (LRR) across a single chromosome of a neuroblastoma cell line. The annotated chromosome regions (A–G) are plotted in the two-dimensional scatterplot of LRR and BAF. The regions labeled A are CN losses and fall in the light red zone (the nonzero BAF represents the presence of a minority of cells without the loss in the sample). The regions labeled B and C represent LOH without CN loss and fall in the blue zone (region B denotes LOH with CN gain). Region D is a four-copy gain with BAF ≈ 0.25 and increased LRR. The regions labeled E are made up of heterozygous SNPs present in two copies. The regions labeled F represent three-copy gains with BAF ≈ 0.33 and increased LRR. Region G denotes an amplification where the very high LRR is sufficient to distinguish it. (Bottom plot) CN as determined by the algorithm that detects the losses, the three- and four-copy gains, and the amplification.


