
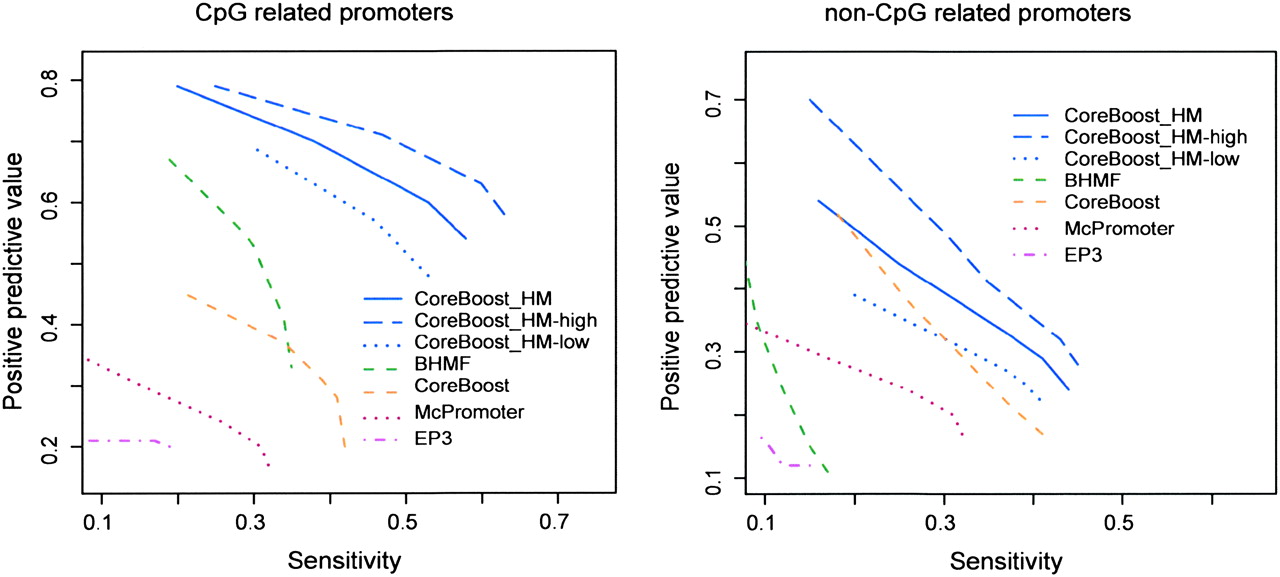
Figure 3.
Positive predictive values (PPV) versus sensitivity for CpG-related and non-CpG-related promoters. The prediction results within 500 bp are clustered for each program. Only a prediction locating within 50 bp of the annotated TSS is regarded as a true-positive hit. The blue dashed and blue dotted lines indicate CoreBoost_HM performance on the promoters of highly expressed genes and low express genes, respectively.


