
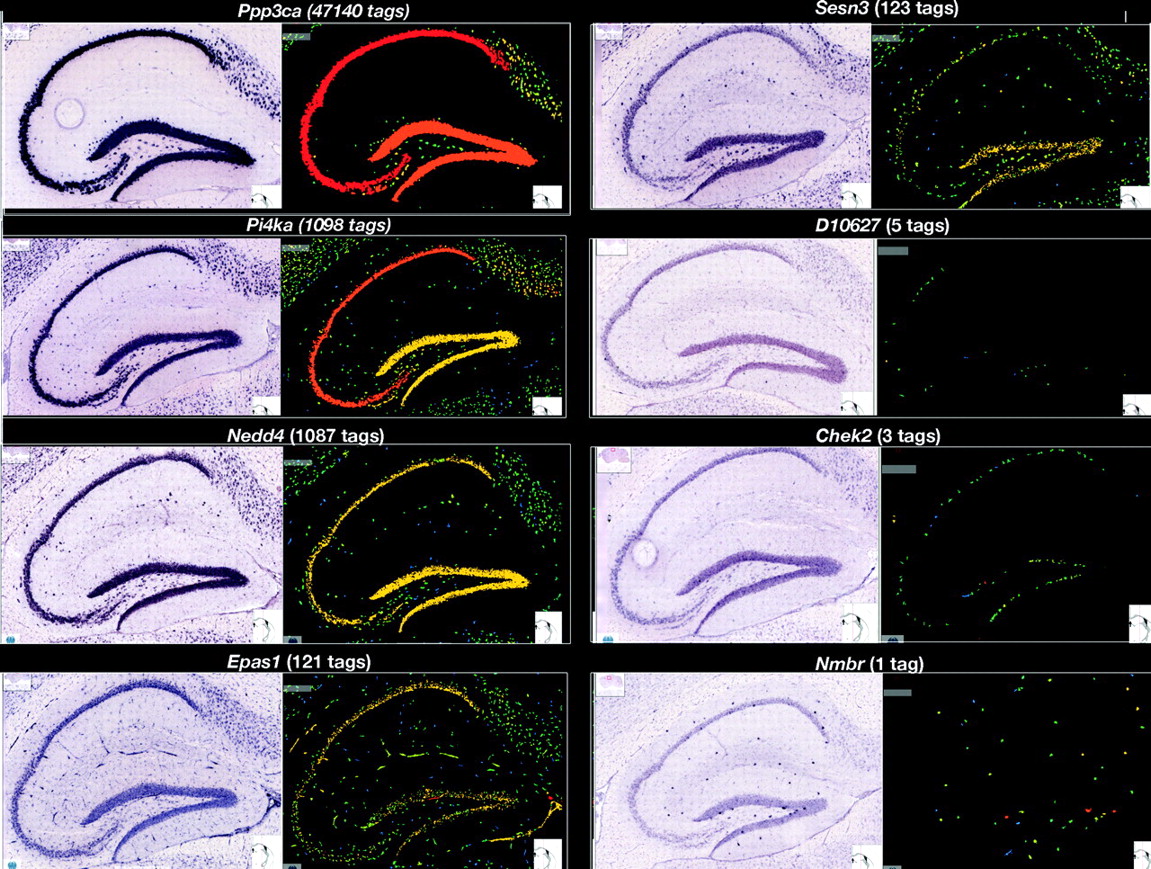
CAGE identifies promoter activity from small subpopulations of hippocampal cells. Examples of correspondence between CAGE tags and signal detected by in situ hybridization, ordered from relatively high expression (from the top left quadrant), expressed as the number of CAGE tags from hippocampus mapping to the gene, to low expression (the lowest right quadrant). On the left the original in situ signal is shown; on the right the in situ hybridization signal is quantified with pseudo-colors where red corresponds to high expression. In situ hybridization images were obtained from the Allen Brain Institute (Lein et al. 2007). Notice that the signal or tags corresponding to less than 5/1.4 × 106 mapped tags correspond to RNAs that are expressed only in a specific subset of cells.


