
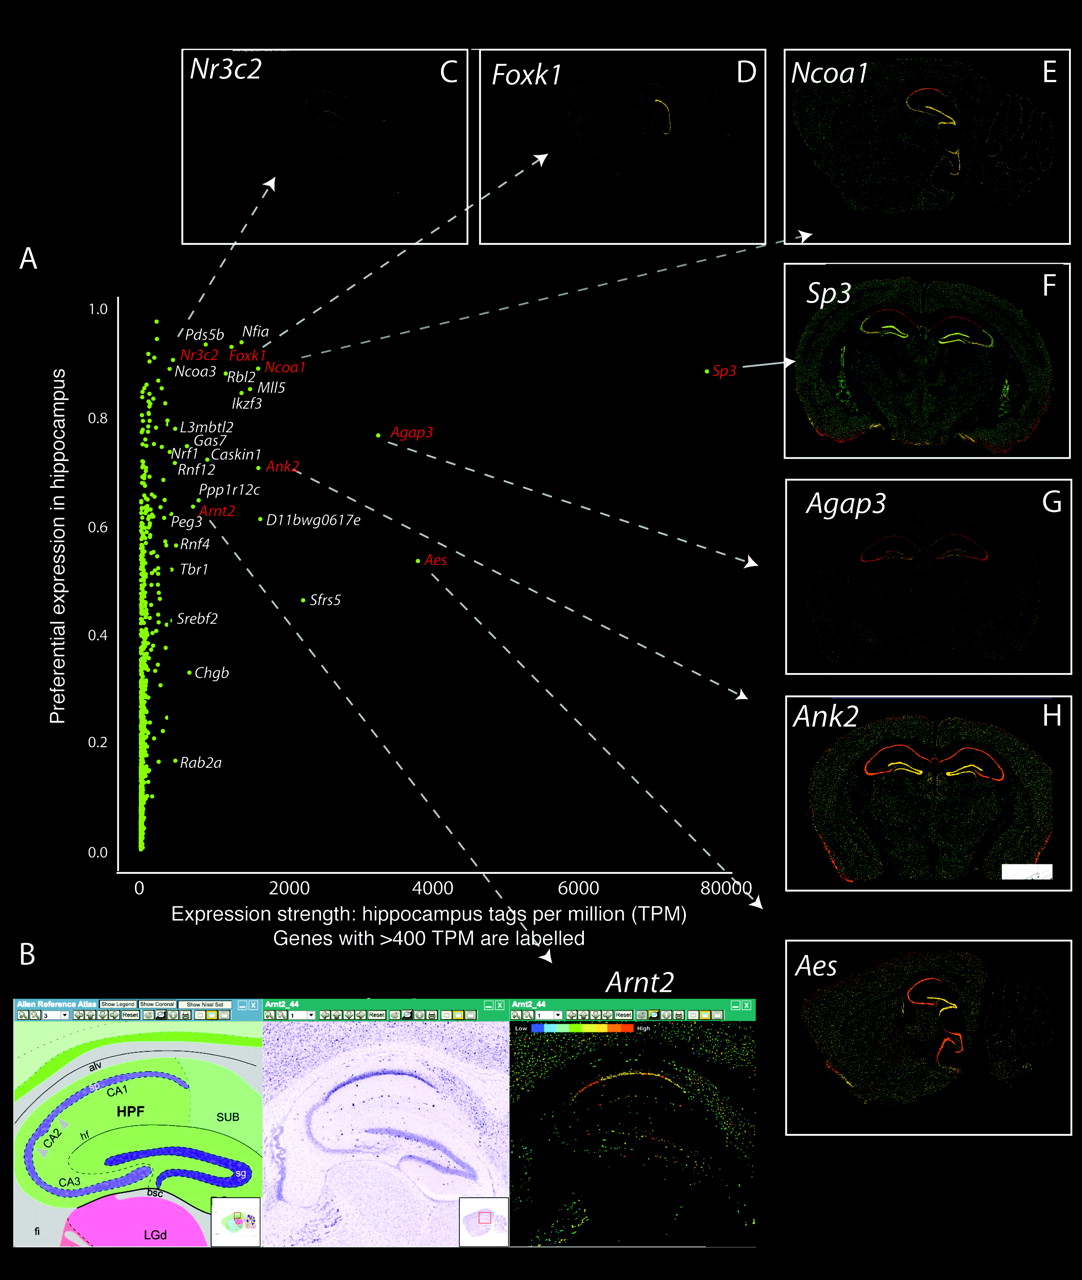
Transcription factor genes with preferential expression in hippocampus. (A) The relation between expression strength (number of hippocampus CAGE tags/million) vs. the “tissue specificity” (fraction of hippocampus tags vs. all brain tags, normalized for library size) of all known transcription factor genes. Note that only a few transcription factor genes are both highly expressed in and highly specific for hippocampus. For example, both in situ hybridization and CAGE data show that the Nr3c2 gene (the mineralocorticoid receptor) is not highly expressed in brain, but almost exclusively expressed in hippocampus, while the Aes gene is expressed in the whole brain with a preference for hippocampus. (C-H and Aes, right) In situ images for some of these factors. (B) In situ hybridization images (Lein et al. 2007) showing the hippocampus expression of the Arnt2 gene. The three images show the Allen reference atlas, the ISH in situ image, and corresponding expression heatmaps.


