
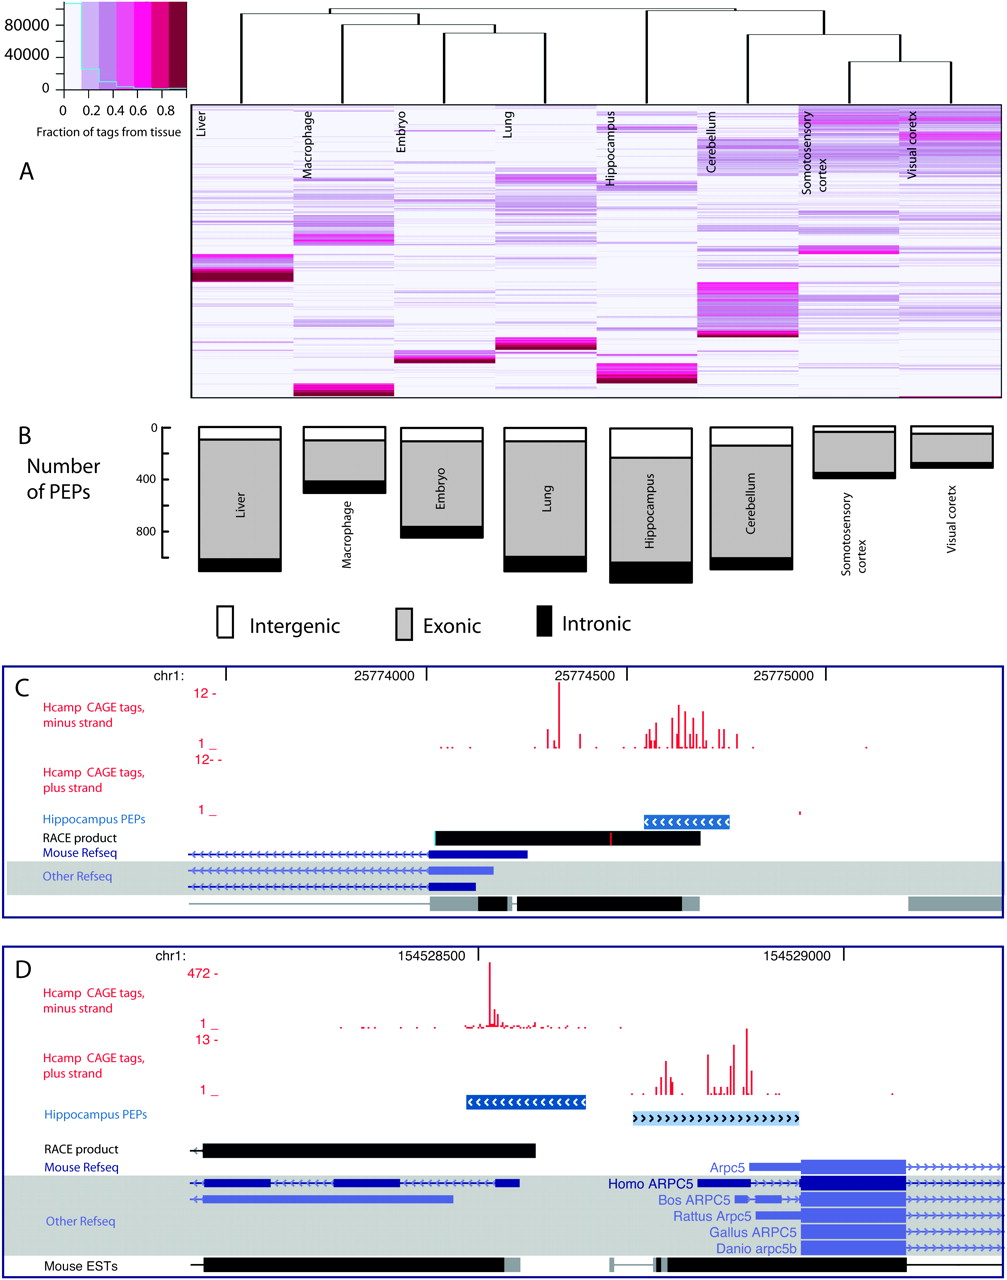
Exploration and validation of identified core promoters. (A) Exploration of tissue usage in all core promoters having more than 30 tags per million using hierarchical clustering, with CAGE tag expression data from the actual core promoters. Preferential usage for a certain tissue (fraction of tags belonging to the tissue in question) is color-coded as shown in the legend. Rows represent individual promoters (the row dendrogram is omitted because of the large number of rows), while columns are the different tissues. (B) Number of core promoters used preferentially in just one tissue (PEPs, as defined in Methods) and the locations of these core promoters relative to known genes. (C,D) Examples of discovery and validation of novel intergenic promoters expressed preferentially in hippocampus. All hippocampus tags are shown as red bar plots (one for each strand). Clusters of tags that are preferentially expressed in hippocampus (hippocampus PEPs) are shown as blue fragments where the color intensity is proportional to the fraction of tags in the cluster from hippocampus vs. other tissues. RACE products are in black. (C) The validation of a proximal alternative promoter to the Bai3 gene. (D) The validation of a promoter upstream of the Arpc5 gene but on the opposite strand; RACE as well as a human orthologous transcript show that this is a distal upstream promoter for the Rgl1 gene.


