
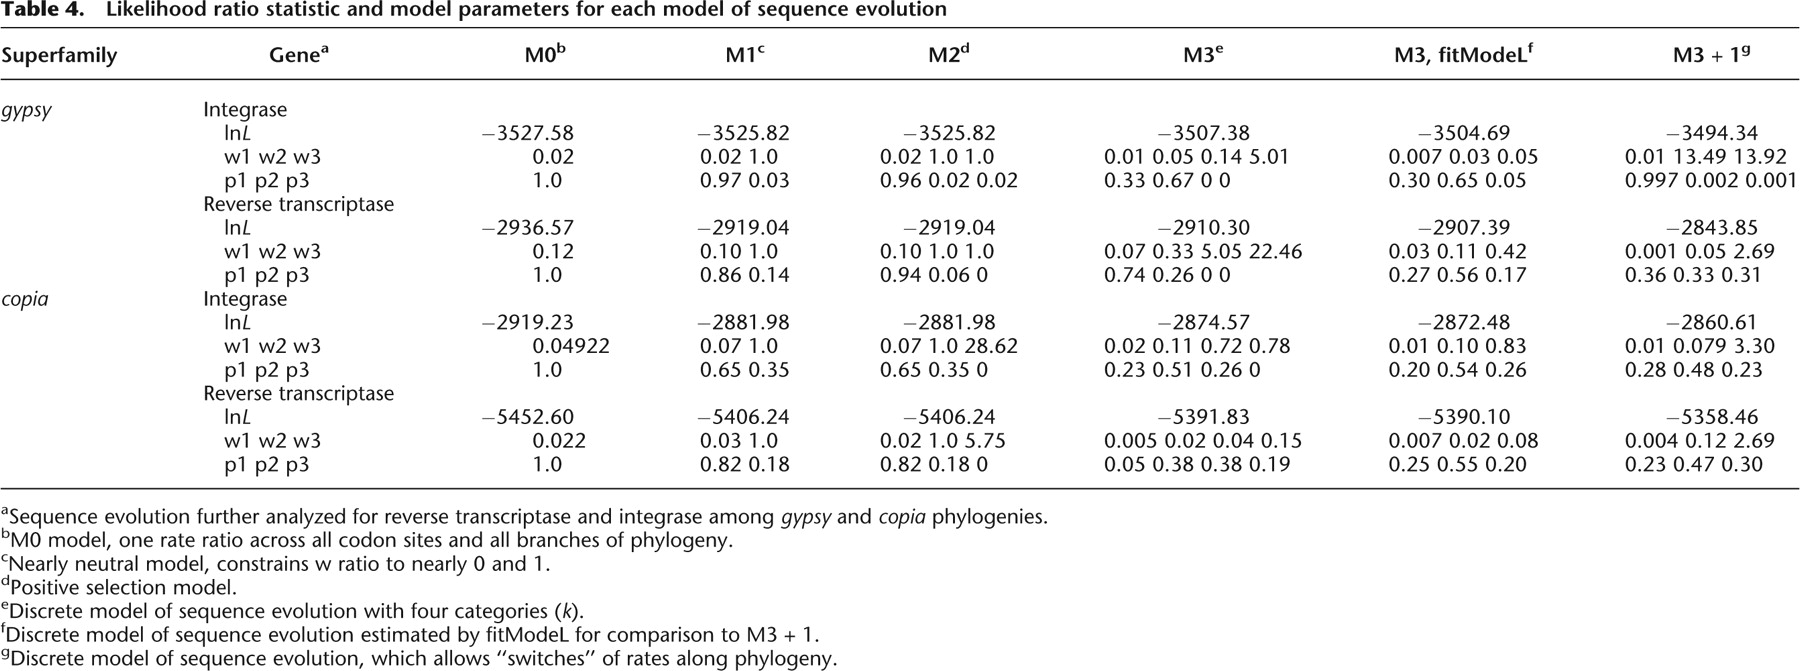
Likelihood ratio statistic and model parameters for each model of sequence evolution
Click on table to view larger version.
-
aSequence evolution further analyzed for reverse transcriptase and integrase among gypsy and copia phylogenies
-
bM0 model, one rate ratio across all codon sites and all branches of phylogeny.
-
cNearly neutral model, constrains w ratio to nearly 0 and 1.
-
dPositive selection model.
-
eDiscrete model of sequence evolution with four categories (k).
-
fDiscrete model of sequence evolution estimated by fitModeL for comparison to M3 + 1.
-
gDiscrete model of sequence evolution, which allows “switches” of rates along phylogeny.


