
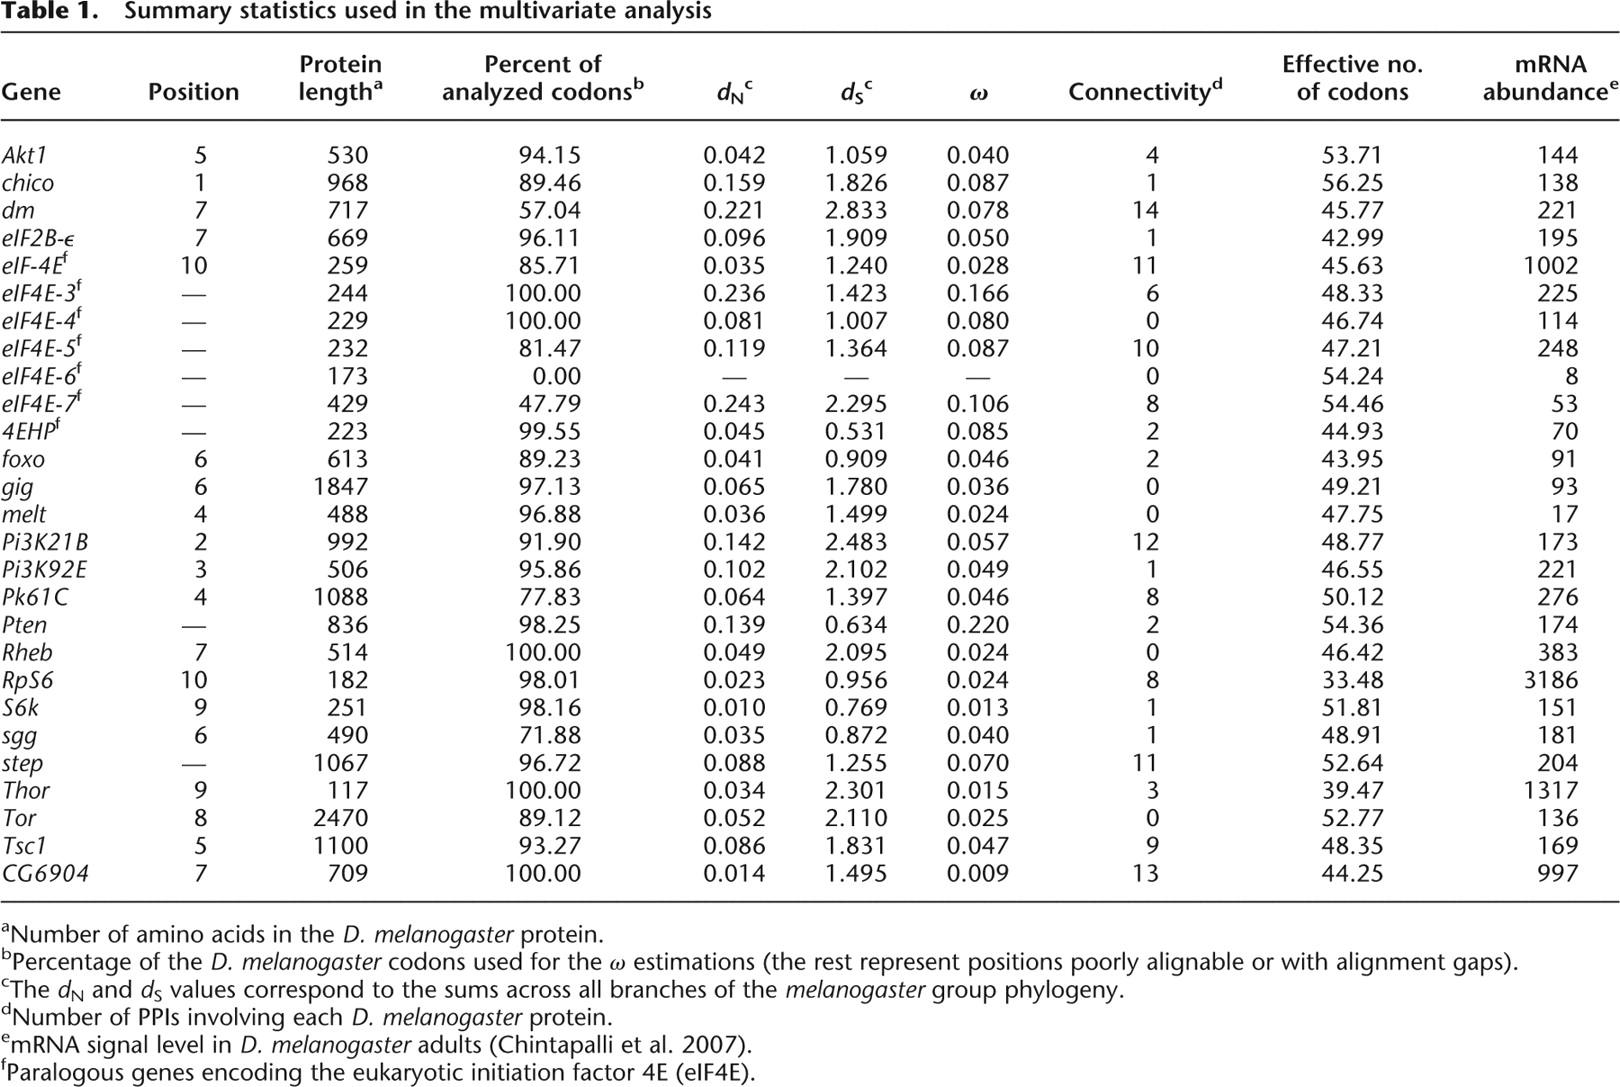
Table 1.
Summary statistics used in the multivariate analysis
Click on table to view larger version.
-
aNumber of amino acids in the D. melanogaster protein.
-
bPercentage of the D. melanogaster codons used for the ω estimations (the rest represent positions poorly alignable or with alignment gaps).
-
cThe dN and dS values correspond to the sums across all branches of the melanogaster group phylogeny.
-
dNumber of PPIs involving each D. melanogaster protein.
-
emRNA signal level in D. melanogaster adults (Chintapalli et al. 2007).
-
fParalogous genes encoding the eukaryotic initiation factor 4E (eIF4E).


