
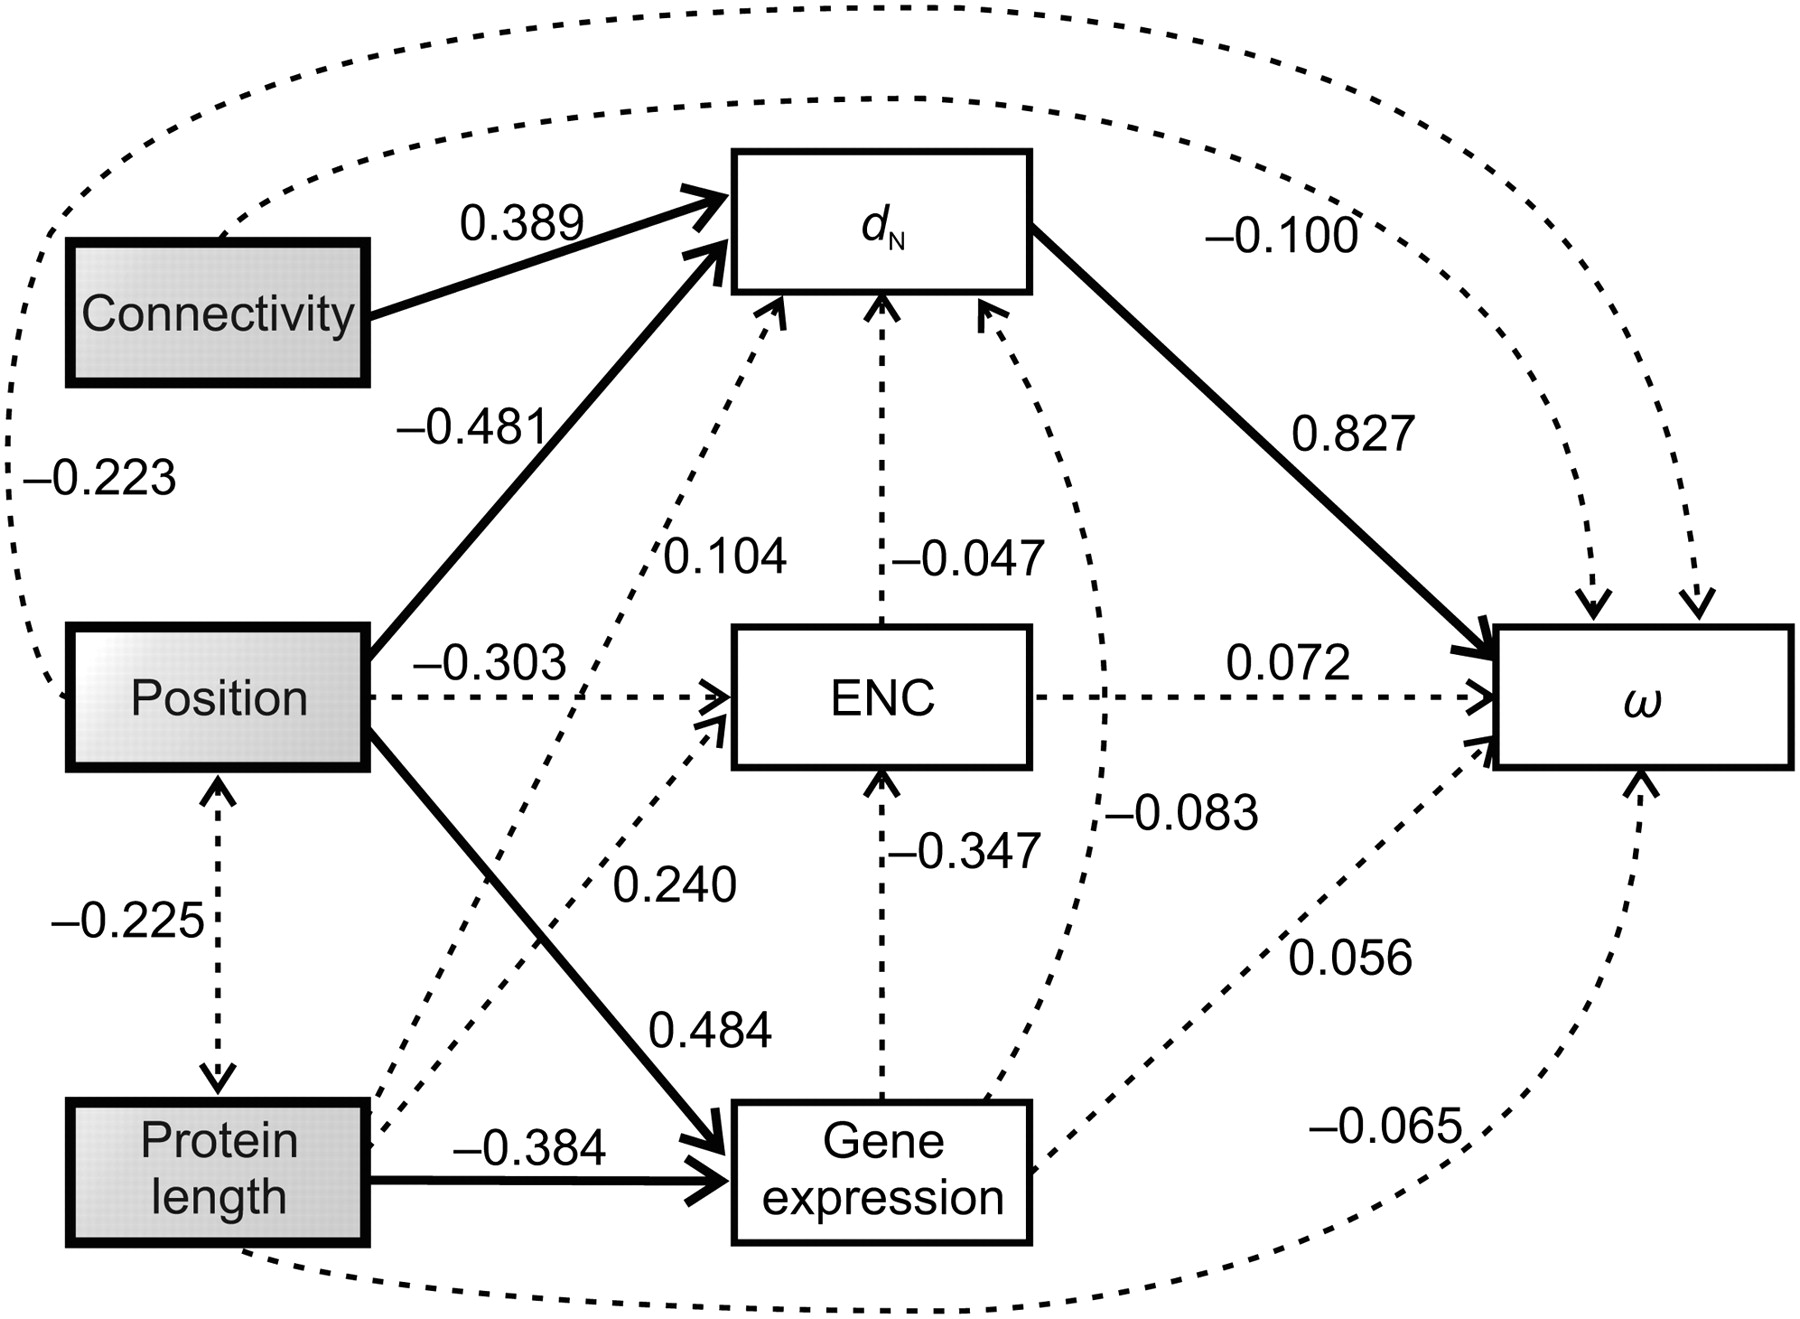
Path analysis used to characterize the relationships among element positions in the IT pathway, nonsynonymous divergence (dN), dN/dS ratio (ω), gene expression level, codon bias (measured by the ENC), protein length, and connectivity. Pathway position, protein length, and connectivity were treated as exogenous variables (those with no explicit causes in the model), while the rest were treated as endogenous variables (those caused by one or more variables in the model). The causal dependencies between variables assumed in the model are represented by single-headed arrows. Correlations between exogenous variables are represented by double-headed arrows. The numbers on the arrows represent the standardized path coefficients (β). Solid and broken lines represent significant and nonsignificant relationships, respectively.


