
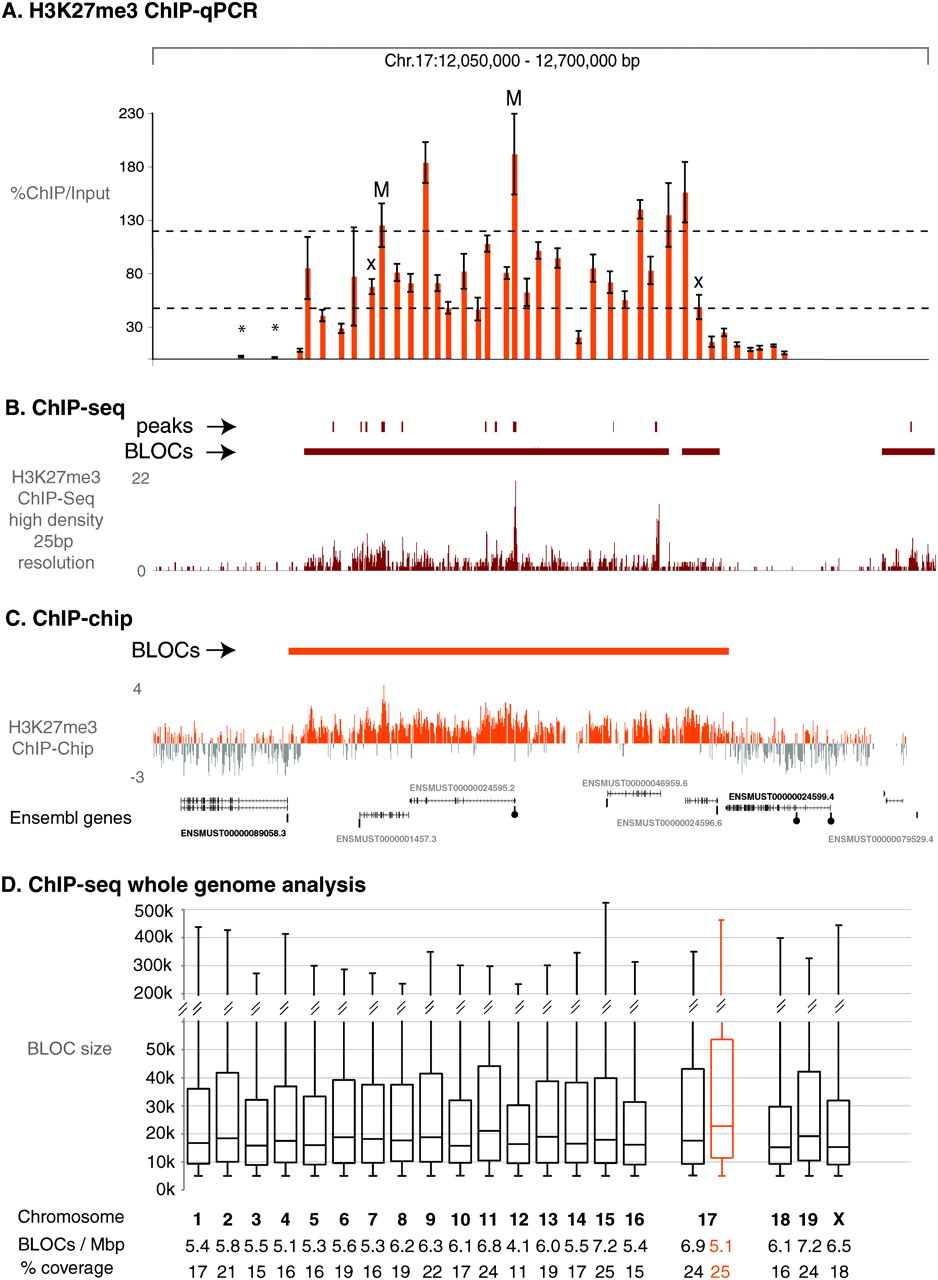
qPCR and ChIP-seq validation of H3K27me3 ChIP-chip BLOCs. (A) Scanning qPCR of one MEFF H3K27me3 ChIP-chip BLOC spanning 365.4 kb in a 650 kb region on mouse chr 17 (12.05–12.70 Mb, UCSC Mouse [mm8], February 2006) with 38 primers (orange bars, error bars indicate variation in three technical replicates) spaced ∼10 kb. Y-axis: %ChIP/input. Mock IP samples were lower than 10% of input with two exceptions (marked with X). Asterisk: low relative qPCR value. M: qPCR assay located in H3K27me3 peaks previously identified in this region by ChIP-seq (Mikkelsen et al. 2007). Lower dotted line indicates the cutoff for significant signals, upper dotted line indicates cutoff for enriched peaks. Primer sequences, qPCR assay details and Ct values are shown in Supplemental Table 2. (B) ChIP-seq of the H3K27me3 ChIP sample assayed by qPCR in A (details in Methods). The ChIP-seq sequence-tag abundance is displayed as 25 bp densities (high density). ChIP-seq BLOCs (horizontal dark red bar) in this region as well as significantly enriched regions (vertical dark red bars) are shown above the ChIP-seq track. Ensembl genes (expressed: black font, silent: gray font, see Supplemental Fig.4) are shown underneath. (C) H3K27me3 ChIP-chip profile (orange peaks) for the region analyzed in (A,B). The orange bar marks the BLOC identified in this region. Genes in this region (black font: expressed, gray font: silent, see Supplemental Fig. 4) are indicated with CG-poor promoters indicated underneath by a bar and CG-rich promoters indicated by a bar plus circle. (D) ChIP-seq BLOCs are identified on all mouse chromosomes in one MEFF data set. Box and whisker plots illustrate the size distribution for each chromosome. The number of BLOCs per Mb and % chromosome coverage by BLOCs is shown below. The ChIP-chip (orange) and ChIP-seq (black) BLOCs from one MEFF data set across chr 17 correlate well, as 82.3% of 1 kb windows show the same H3K27me3 BLOC state (BLOC or no BLOC). Note that MEFF cells are XO (data not shown) and thus have one active X chromosome.


