
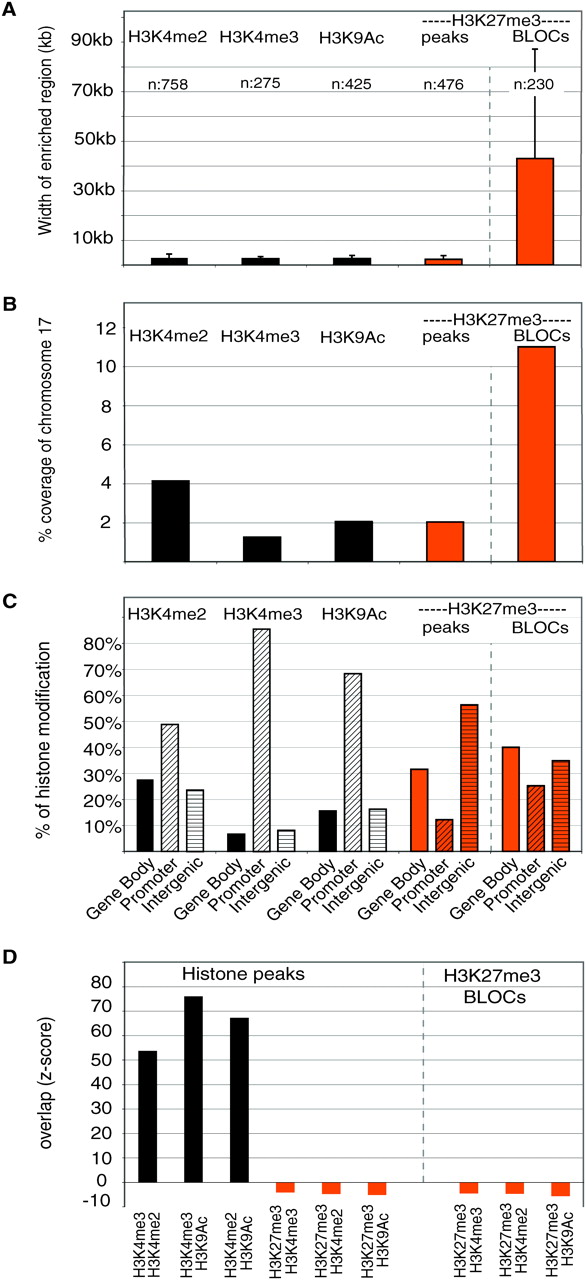
Overview of active and repressive marks on mouse chr 17 in MEFs. The analysis of modifications forming peaks (H3K4me2, H3K4me3, and H3K9Ac) was based on the sum of all chr 17 regions with a probe density of at least eight oligonucleotides per 1500 bp. The analysis of modifications forming BLOCs (H3K27me3) was based on the whole mouse chr 17 tiling array. Data from two independent MEF cell lines (MEFB1 and MEFF) were merged for all analyses (Supplemental Table 1). (A) Chromosome-wide analysis showing the average width of genomic regions enriched by four histone modifications on chr 17, as analyzed by ChIPOTle (all modifications) or the BLOCs algorithm (H3K27me3). Only regions found to be enriched in all technical and biological replicates (Supplemental Table 1) were used in this analysis. (B) The percentage of chr 17 covered by four histone modifications analyzed by ChIPOTle peaks (all modifications) or the BLOCs algorithm (H3K27me3). (C) The percentage of ChIPOTle peaks (all modifications) or BLOCs (H3K27me3) located at the gene body excluding the promoter (solid bar), promoters (diagonally striped bar), and intergenic regions (horizontally striped bar). (D) The significance of overlap between genomic regions enriched for different histone modifications was calculated by identifying Z-scores for all possible pairs of ChIPOTle peaks (all modifications) and BLOCs (H3K27me3) (details in Methods). A high Z-score identifies an overlap that occurs more often than expected compared to a randomized data set.


