
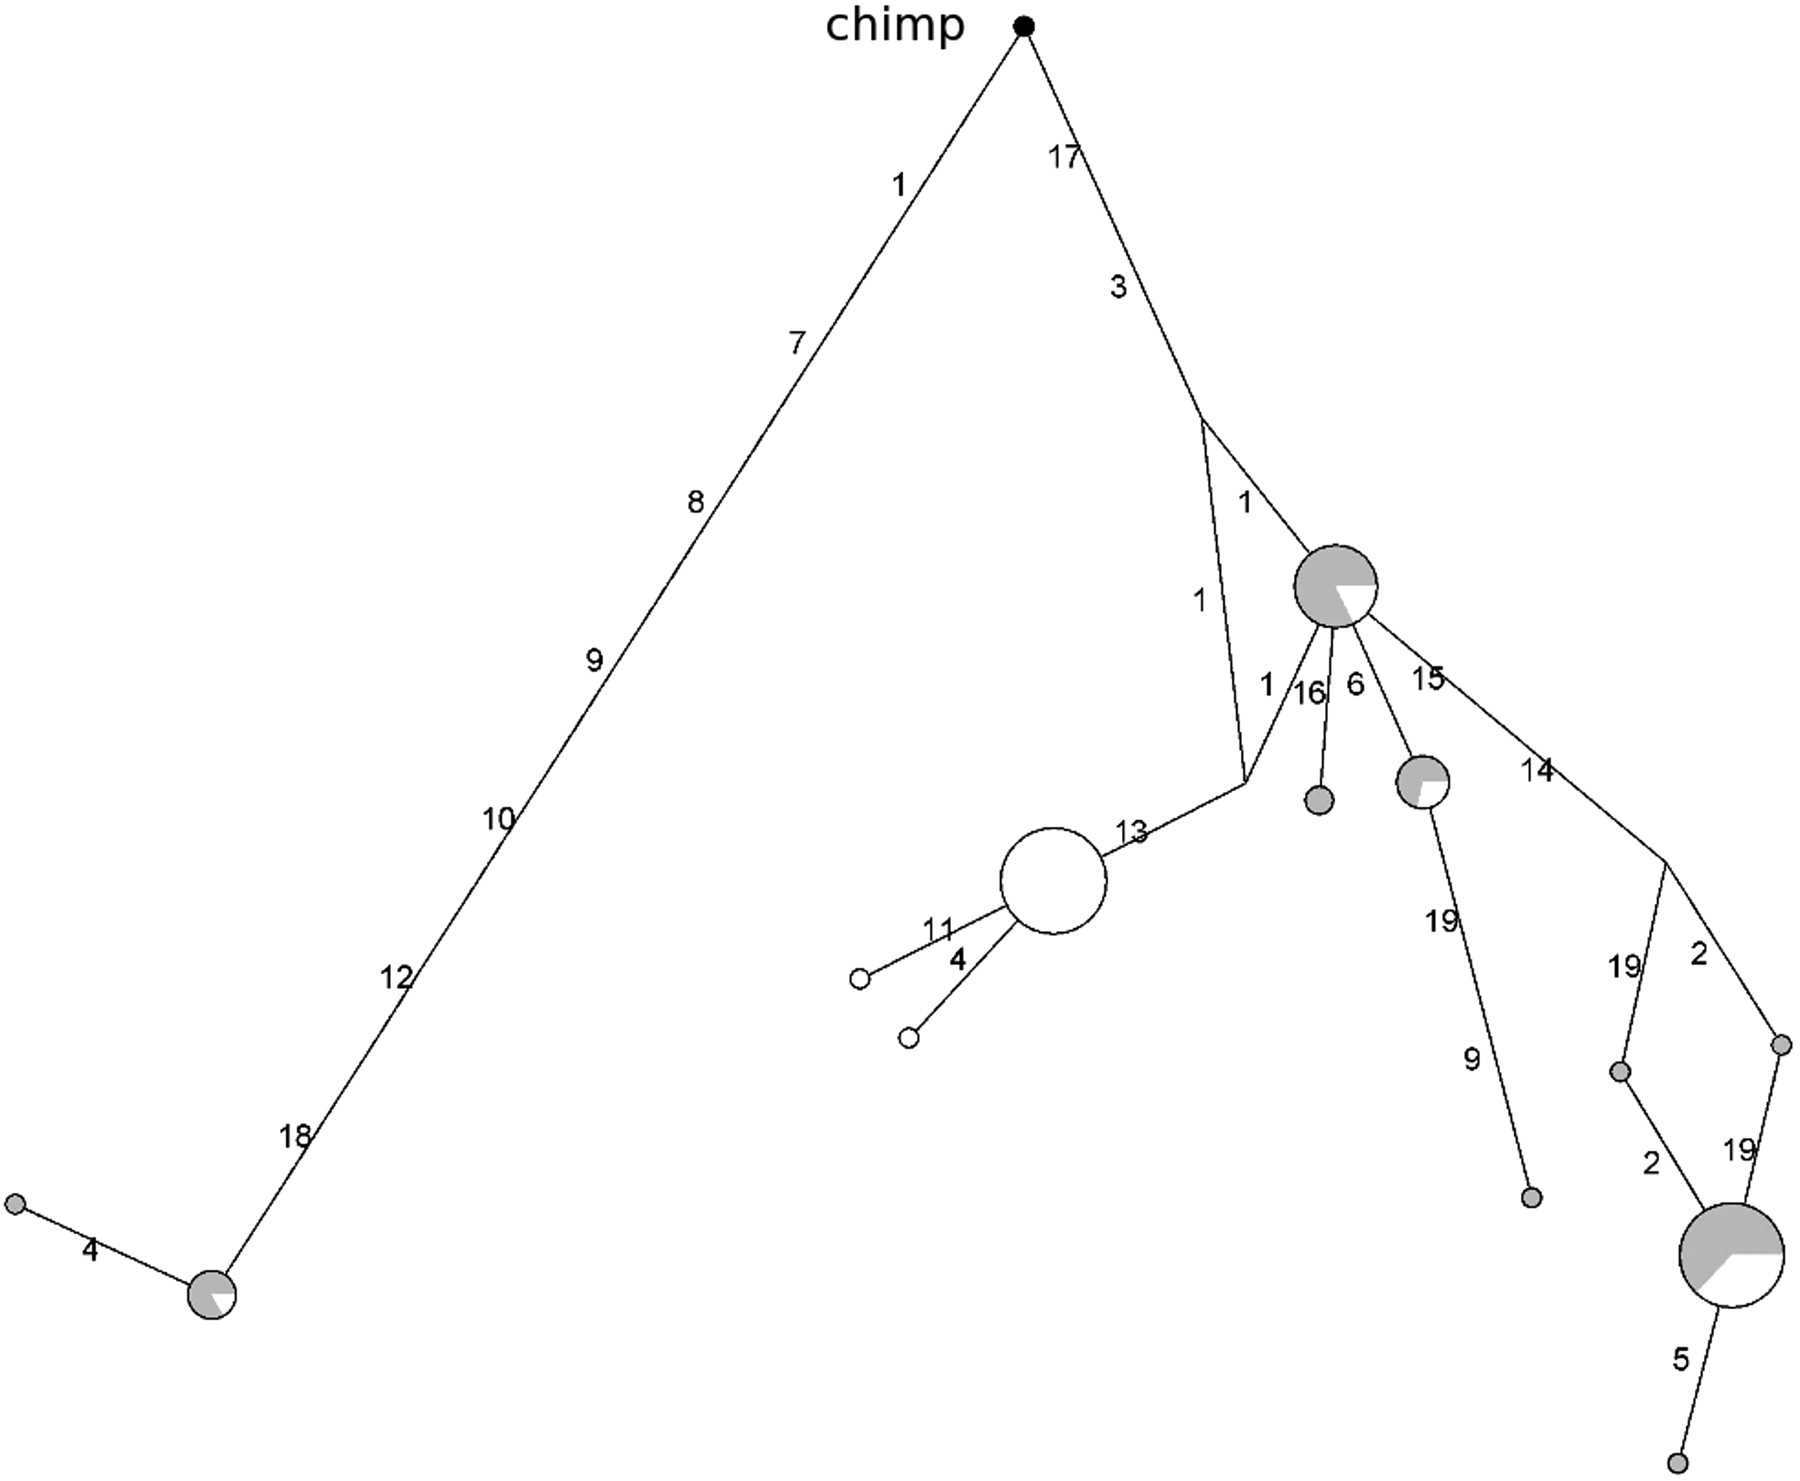
Figure 6.
Genealogy of BSG haplotypes reconstructed through a median-joining network. The analysis corresponds to the gene region spanning nucleotides 8500–10,300. Population color codes are as follows: (white) EA; (gray) YRI.


