
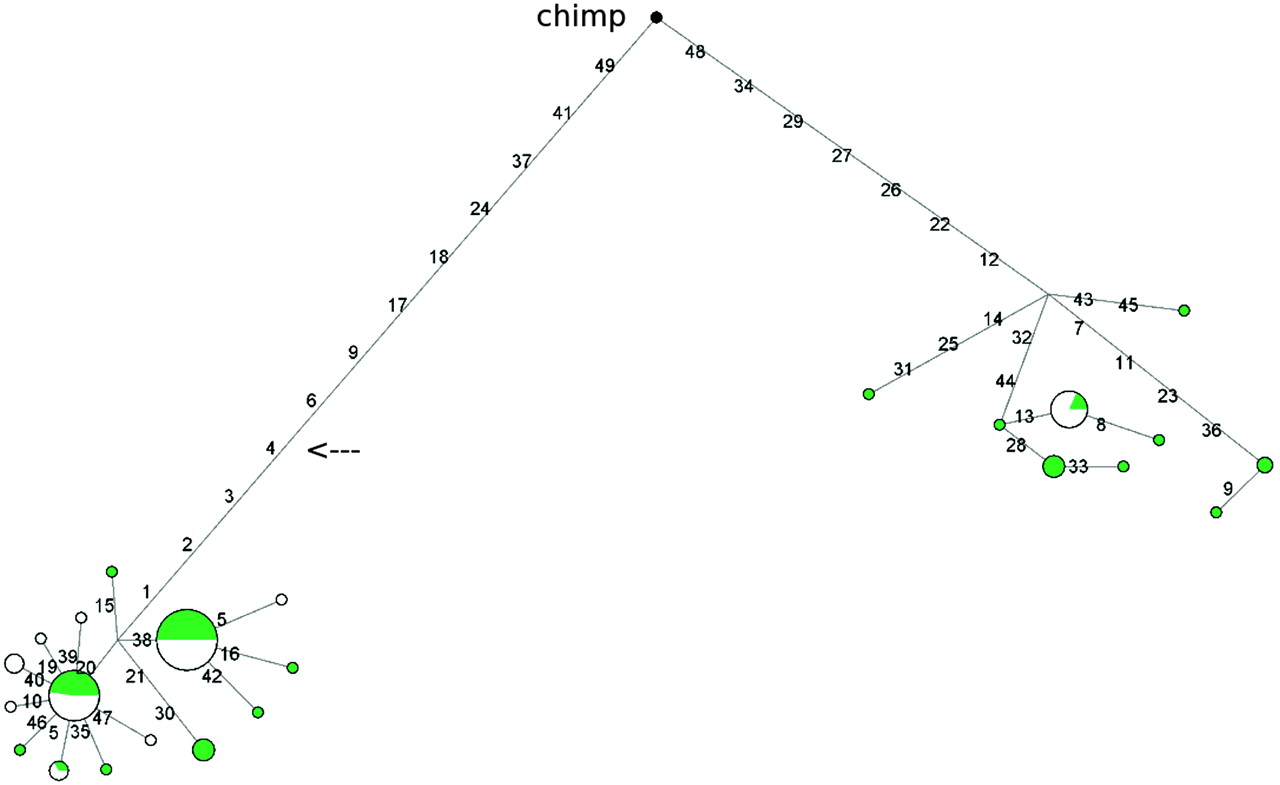
Figure 2.
Genealogy of CD55 haplotypes reconstructed through a median-joining network. The analysis corresponds to the gene region spanning nucleotides ∼9500–18,300 (as described in the text). Each node represents a different haplotype, with the size of the circle proportional to the haplotype frequency. Nucleotide differences between haplotypes are indicated on the branches of the network. Circles are color-coded according to population (green, AA; white, EA). The chimpanzee sequence is also shown. The arrow shows the position of rs6700168 (Table 1). Note that the relative position of mutations along a branch is arbitrary.


