
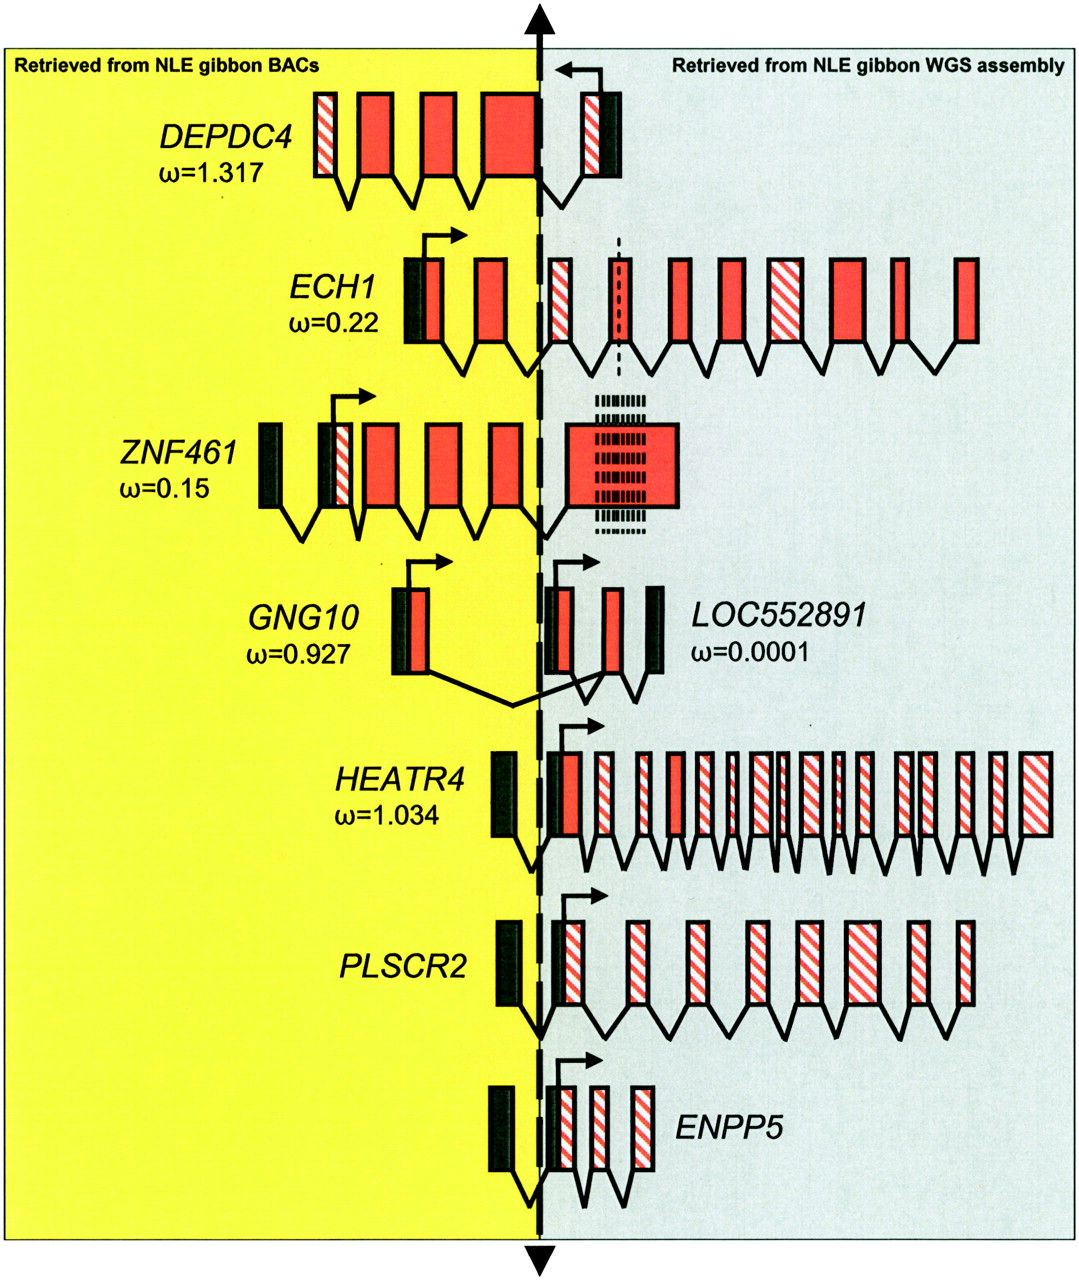
Gene disruptions at synteny breaks. The schematic shows the seven genes mapping to the breakpoints (dashed vertical arrow). One part of the gene is contained in the BAC (yellow region) and the other part is lost due to synteny break (gray region). Both gene parts were reconstructed either from the gibbon BAC sequences or contigs assembled from the gibbon WGS reads (see text). Coding exons (orange, completely retrieved sequences; stripes, missing sequences in gibbons) and noncoding exons (black) are depicted. (Black arrows) Transcriptional orientation. The dN/dS ratios (ω) and number of synonymous and nonsynonymous substitutions calculated for the available gene fragments (orange) are also shown. Vertical dashed lines on the exons indicate location of stop codons. The figure is not to scale.


