
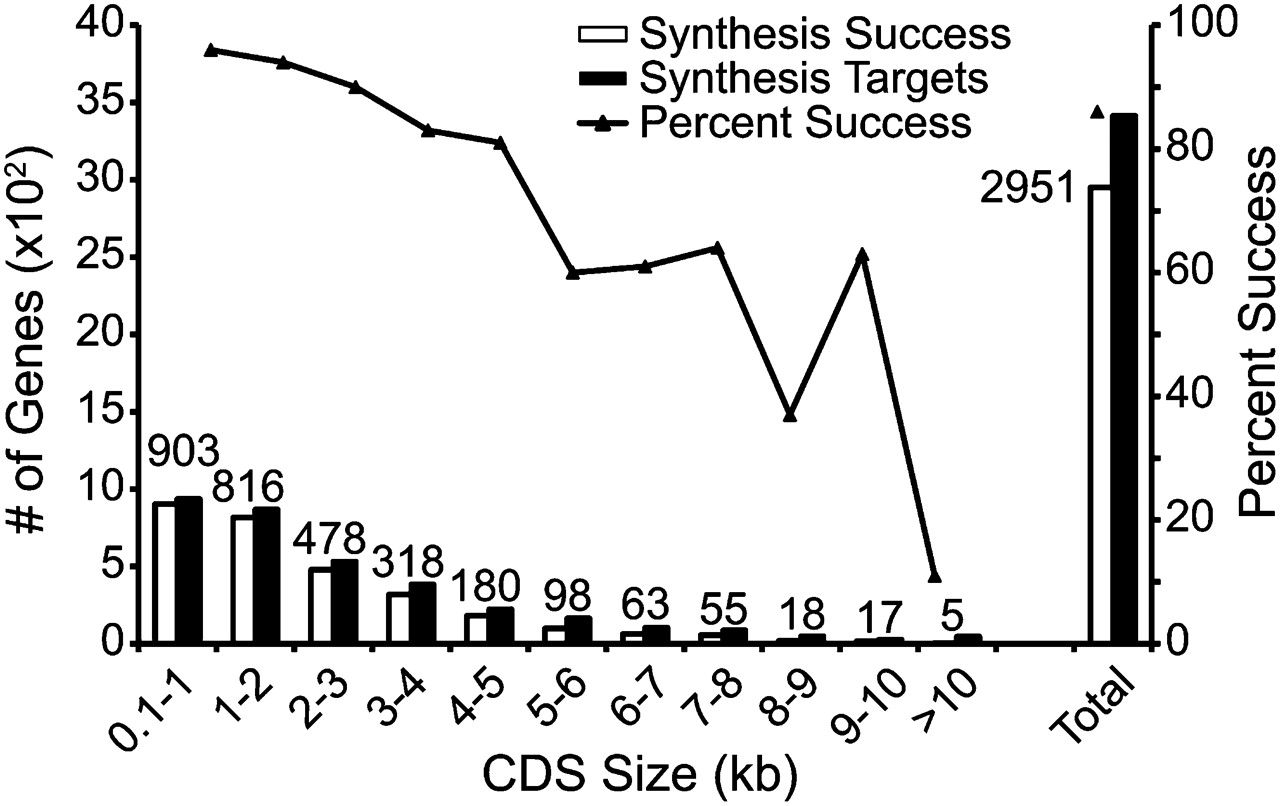
Figure 4.
Synthesis success versus target size. (Black bars) The number of assigned targets in each size range; (white bars) the number of assigned targets that were obtained as full-CDS clones, with the number of clones recovered shown above the bars. The triangles and trendline show the percentage recovered for each size group. RefSeq targets where the assigned CDS later was changed, suppressed, or withdrawn (233 in total) were excluded from these calculations.


