
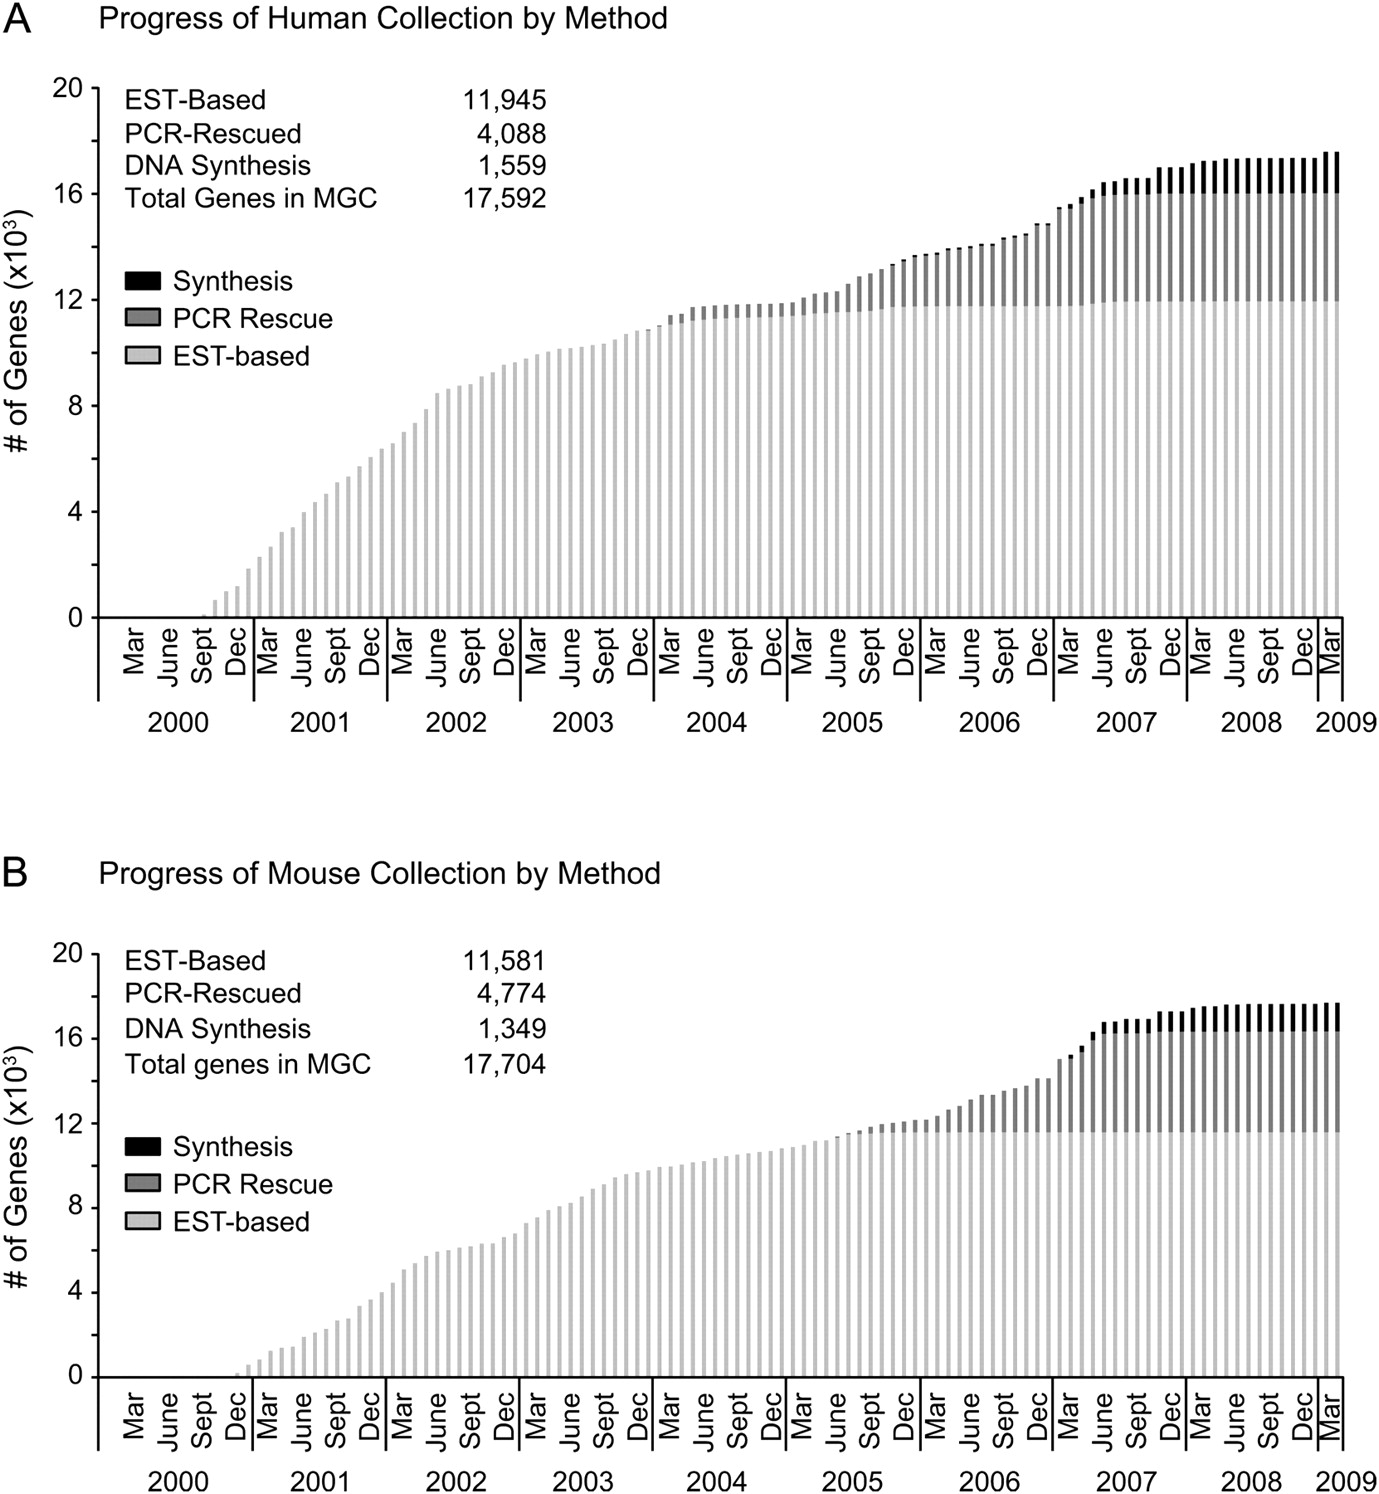
Figure 2.
MGC progress represented over time by method. (A) Human; (B) mouse. The absolute contribution (by genes represented) of each cloning method is shown for EST-based cloning, PCR-Rescue, and DNA synthesis, over time.


