
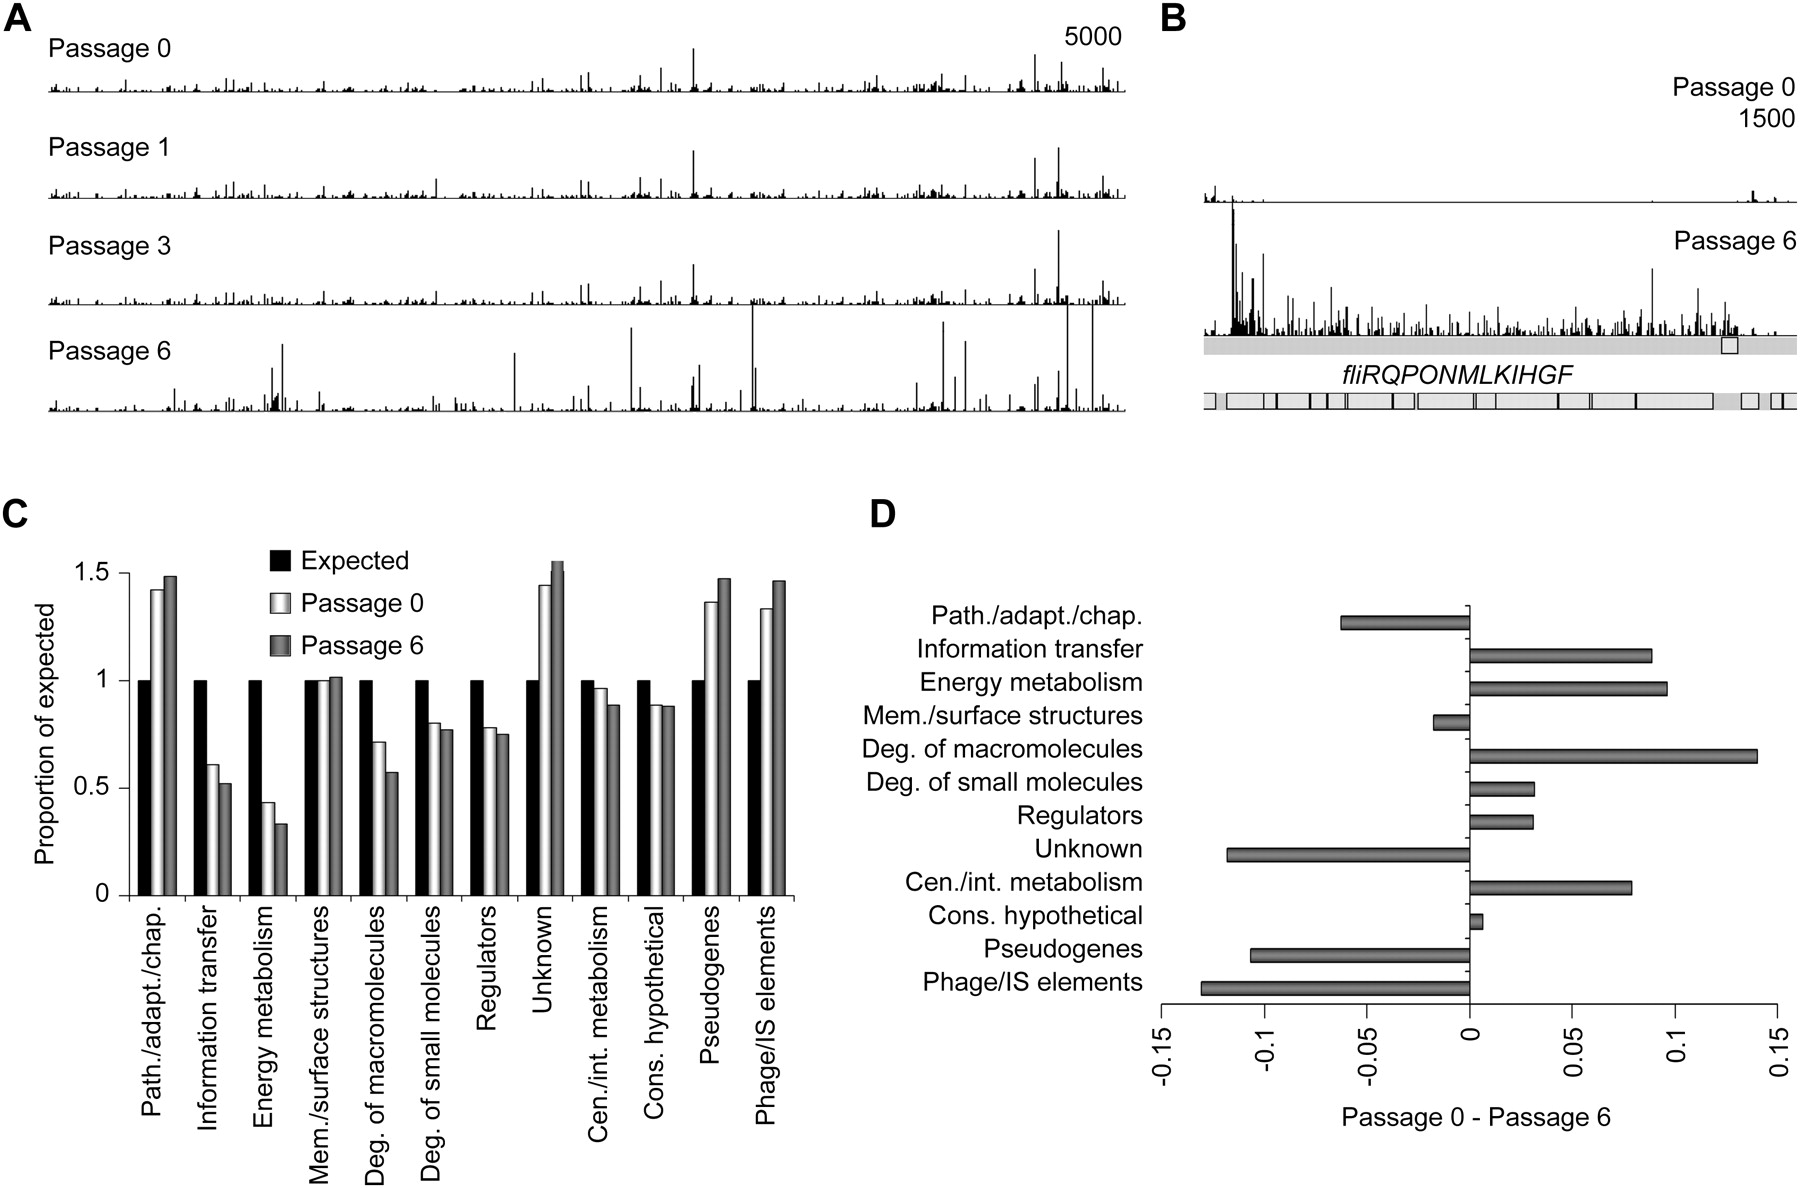
Changes in composition of the mutant pool with passaging. (A) Frequency and distribution of transposon directed insertion-site sequence reads across the entire Ty2 genome in the original 1 million mutant pool (top) and following growth in broth of the pool through one, three, and six passages. The plot has a window size of 3. (B) Frequency and distribution of sequence reads across the flagella (fli) operon at passage 6 compared to the original mutant pool (passage 0) showing an increase in the number of flagella gene mutants following growth. (C) With genes divided into functional classes based on the S. Typhi CT18 annotation, the observed number of different transposon insertion sites per functional gene class is expressed as a proportion of the insertion sites expected if sites were distributed randomly for passages 0 and 6. Values greater than 1 indicate that insertions into the gene class are better tolerated, while values less than 1 indicate that insertions into the gene class are more poorly tolerated. (D) Passage 0 value minus Passage 6 value from C plotted to emphasize how much the proportion of expected differs between these passages. Larger values indicate a more important role during growth in broth for the gene class than smaller or negative values. Path./adapt./chap., pathogenicity, adaptation, chaperones; Mem./surface structures, membrane/surface structures; Deg., degradation; Cen./int. metabolism, central/intermediary metabolism; Cons. hypothetical, conserved hypothetical.


