
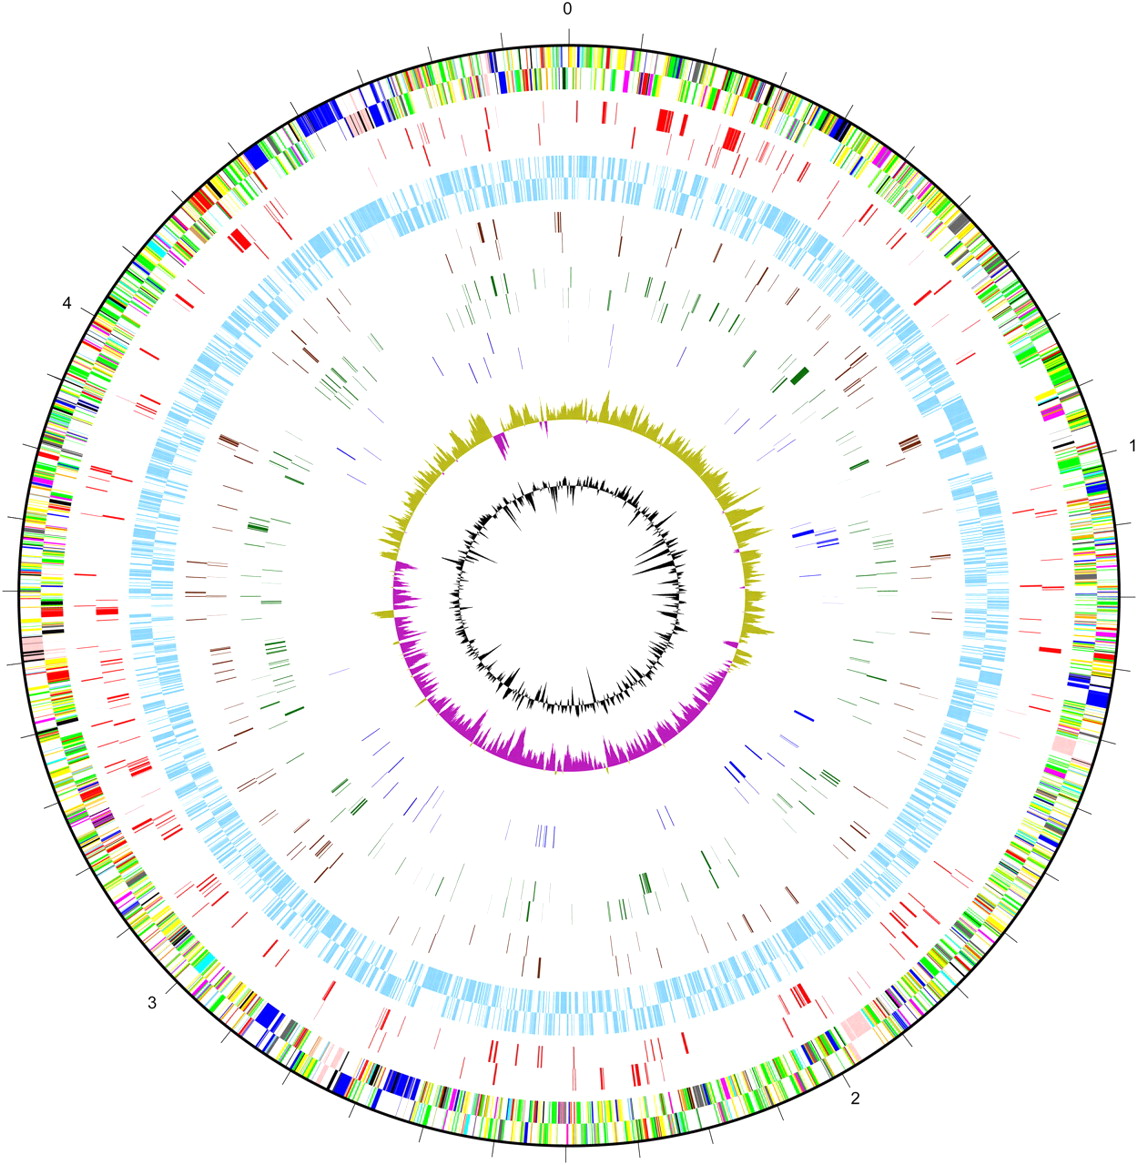
Genetic map showing results of simultaneous assay of the whole S. Typhi Ty2 genome. The outer scale is marked in megabases. Circles range from 1 (outer circle) to 8 (inner circle) and represent genes on both forward and reverse strands. Circle 1, all genes (color-coded according to function: dark blue, pathogenicity/adaptation; black, energy metabolism; red, information transfer; dark green, membranes/surface structures; cyan, degradation of macromolecules; purple, degradation of small molecules; yellow, central/intermediary metabolism; light blue, regulators; pink, phage/IS elements; orange, conserved hypothetical; pale green, unknown function; brown, pseudogenes); circle 2, essential genes (red); circle 3, nonessential genes (light blue); circle 4, genes involved in bile tolerance (brown); circle 5, genes advantageous for growth over six passages (dark green); circle 6, genes disadvantageous for growth over six passages (dark blue); circle 7, GC bias [(G – C)/(G + C)]; khaki indicates values > 1; purple < 1; circle 8, %(G + C) content.


