
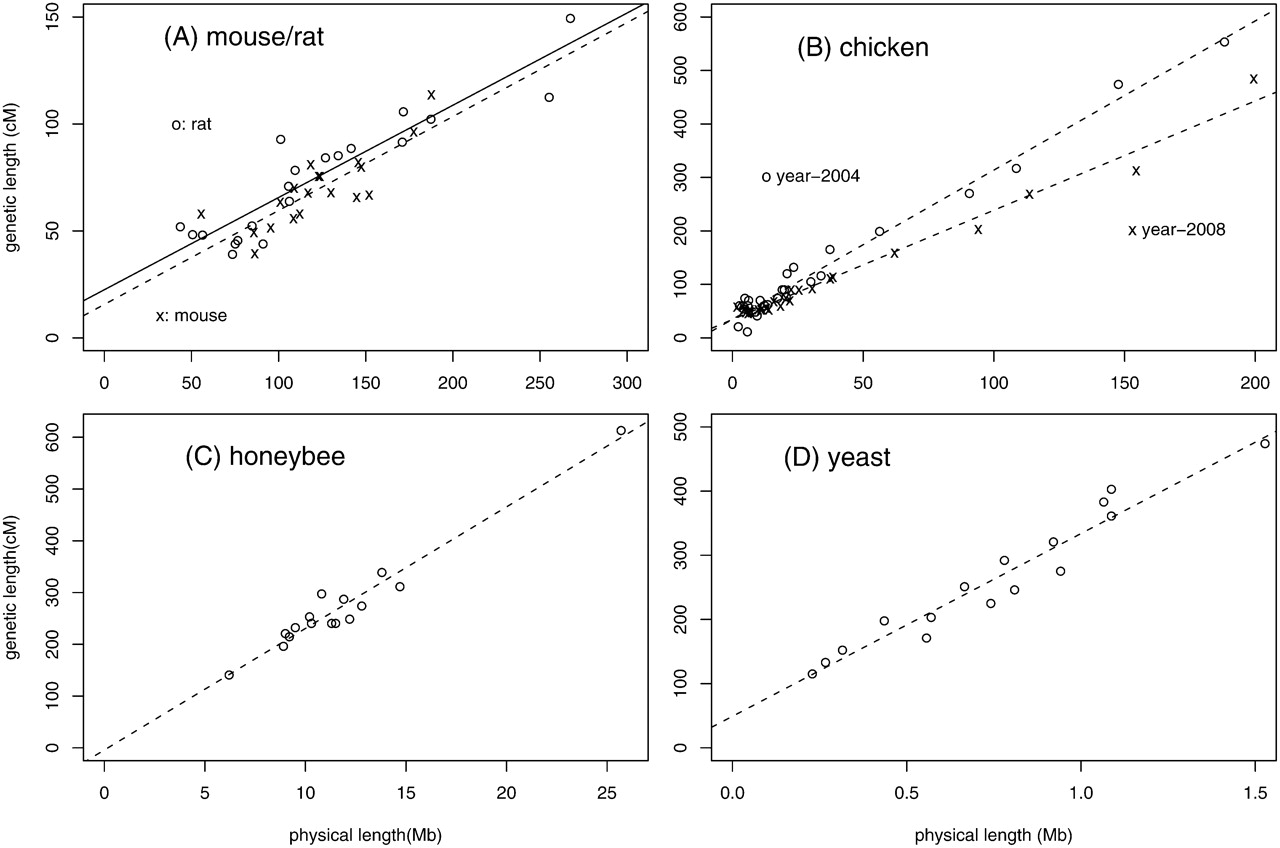
The genetic length (in centimorgans, cM) vs. physical length (in megabases, Mb) plotted for five genomes. (A) (×) Mouse (Mus musculus) and (○) rat (Rattus norvegicus). [Data source: Table 1 of Jensen-Seaman et al. 2004.] The regression lines are: y = 15.62 + 0.44x (mouse), y = 22.49 + 0.43x (rat). (B) Chicken (Gallus gallus). [Source: old data (year 2004, ○) are from Supplemental Table S2 of the International Chicken Genome Sequencing Consortium (2004); new data (year 2008, ×) are from Table 1 of Groenen et al. (2009).] The regression line is y = 34.68 + 2.79x (old data) and y = 34.23 + 2.04x (new data). (C) Honeybee (Apis mellifera). [Source: Table 2 of Beye et al. 2006.] The regression line is y = −4.22 + 23.49x. (D) Budding yeast (Saccharomyces cerevisiae). [Source: http://downloads.yeastgenome.org/chromosomal_feature/SGD_features.tab.] The regression line is y = 49.12 + 287.74x.


