
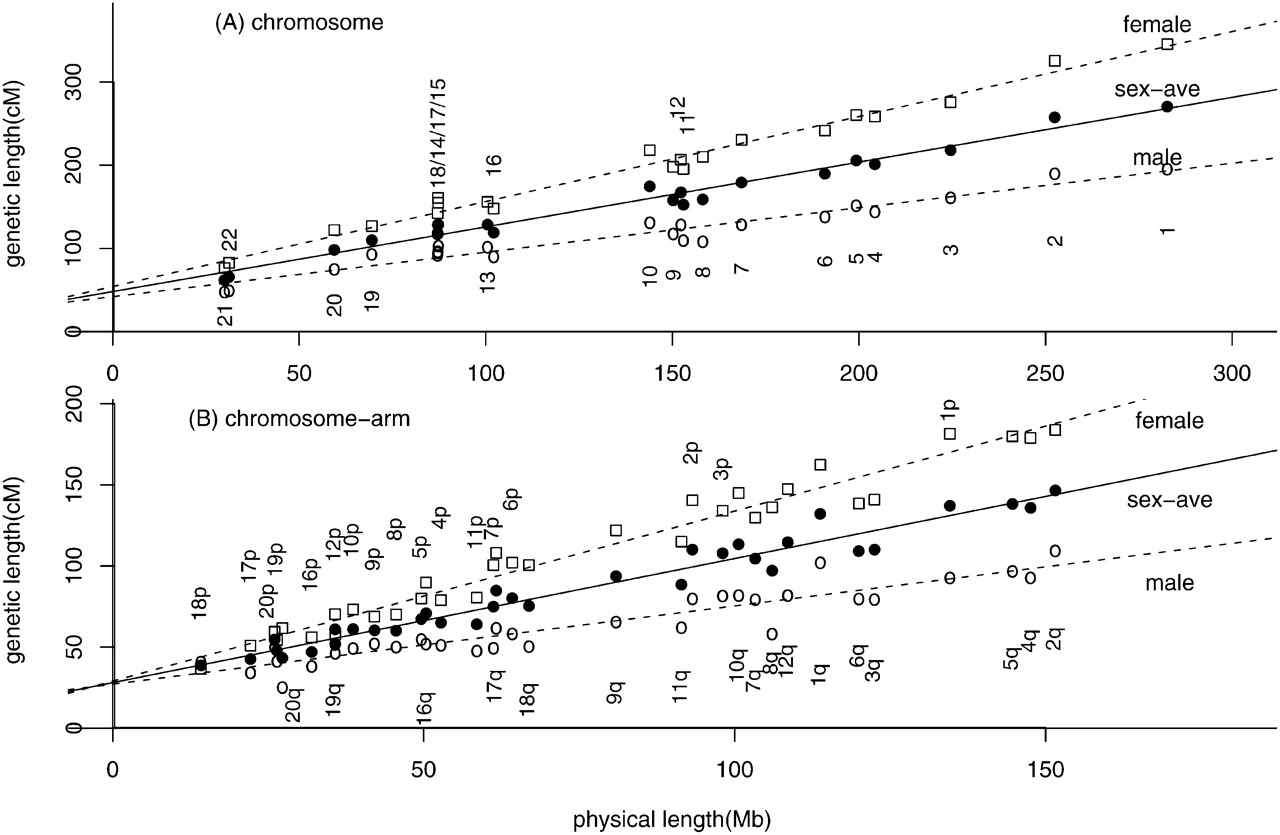
Figure 1.
Two-parameter regression of human genetic length over physical length. (A) Analysis at the chromosome scale. (Squares) Female, (open circles) male, and (solid circles) sex-averaged genetic length of each chromosome (in centimorgans, cM) is plotted against its physical length (in megabases, Mb). The least-square regression lines are: y = 54.2 + 1.02x (female), y = 42.0 + 0.52x (male), and y = 48.1 + 0.78x (sex average). (B) Analysis of metacentric chromosome at the chromosome-arm scale. The best-fit regression lines are: y = 29.0 + 1.05x (female), y = 27.1 + 0.48x (male), and y = 28.0 + 0.77x (sex average).


