
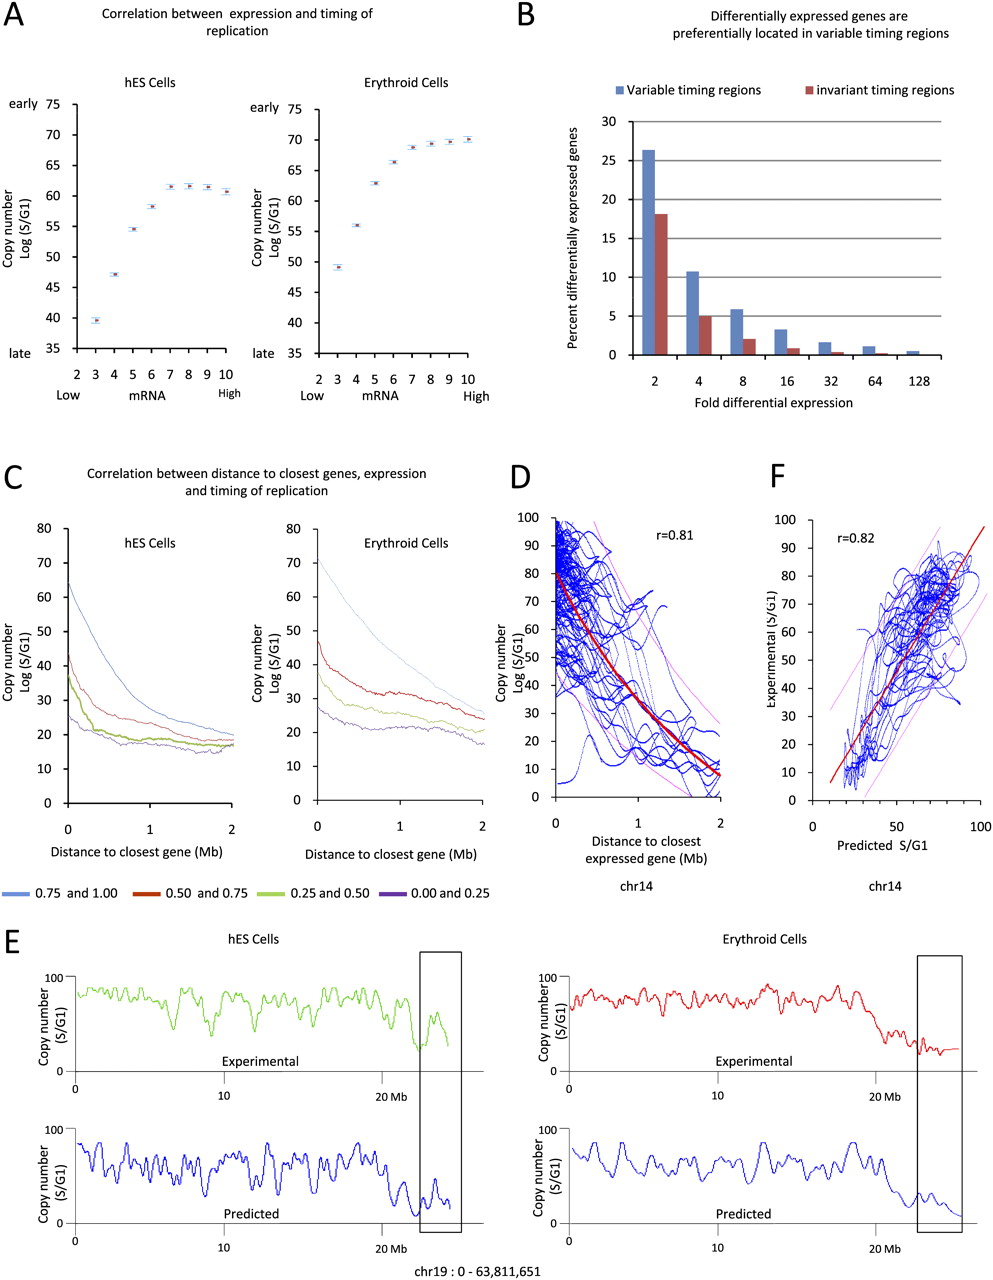
Timing of DNA replication and gene transcription. (A) Scatterplot illustrating the relationship between gene transcription and timing of replication in basophilic erythroblasts and in hESC cells. (X-axis) Mean mRNA expression (determined using Affymetrix U133plus arrays) grouped into 10 bins of equal number of probesets and of increasing expression signals. (Y-axis) Average TimEX values (and standard errors) for all 5-kb genomic windows containing an Affymetrix U133plus probeset are plotted. On average, expressed genes are replicating earlier than unexpressed genes. (B) Histograms illustrating that differentially expressed genes are preferentially located in regions where timing differs between hESC and erythroid cells. (X-axis) Fold differential expression; (y-axis) percent differentially expressed genes. (C) Scatterplots illustrating relationship between timing and distance to expressed genes: Distances of all 5-kb genomic windows to the closest 5-kb window containing either a highly expressed Affymetrix Probeset (top 0–25 quartile), a moderately expressed (25–50 quartile), a poorly expressed (50–75 quartile), or a silent (75–100 quartile) probeset were calculated (see text). The average TimEX value for all windows at the same distance to a probeset was then plotted against their distances to the closest probeset for each of the four quartiles. This plot reveals that the timing of replication is highly dependent on distance to highly expressed probesets since (in the case of erythroid cells) the averaged TimEX value was about 76 for windows containing an actively expressed probeset (distance = 0), and decreased to <30 for windows more than 2-Mb away from a highly expressed probeset. Analysis of the other quartiles shows that the relationship between timing and distance to probeset decreases for less expressed genes, and almost completely disappears for silent genes, suggesting that gen-expression levels directly correlate with timing of origin firing. (D) TimEX values (not averaged) for 5-kb windows covering chromosome 14 (blue line) are plotted against the distance of each window to the closest highly expressed gene (top 0–10 percentile) to illustrate the variability of the TimEX values (which cannot be appreciated in C because of averaging). The red line illustrated the best fitting reciprocal equation (r = 0.81). Supplemental Figure S12 shows similar analysis for all chromosomes. (D) Profiles of predicted timing of replication obtained by calculating the inverse of the distance of each genomic window to the closest Affymetrix Probeset and multiplying it by a coefficient equal to the normalized expression signals of the same probeset (see Methods). The red boxes highlight a peak that is present in hESC but not in erythroid cells, both in the experimental and in the predicted values. (E) Scatterplot illustrating correlation between experimental and predicted timing profiles for chromosome 14.


