
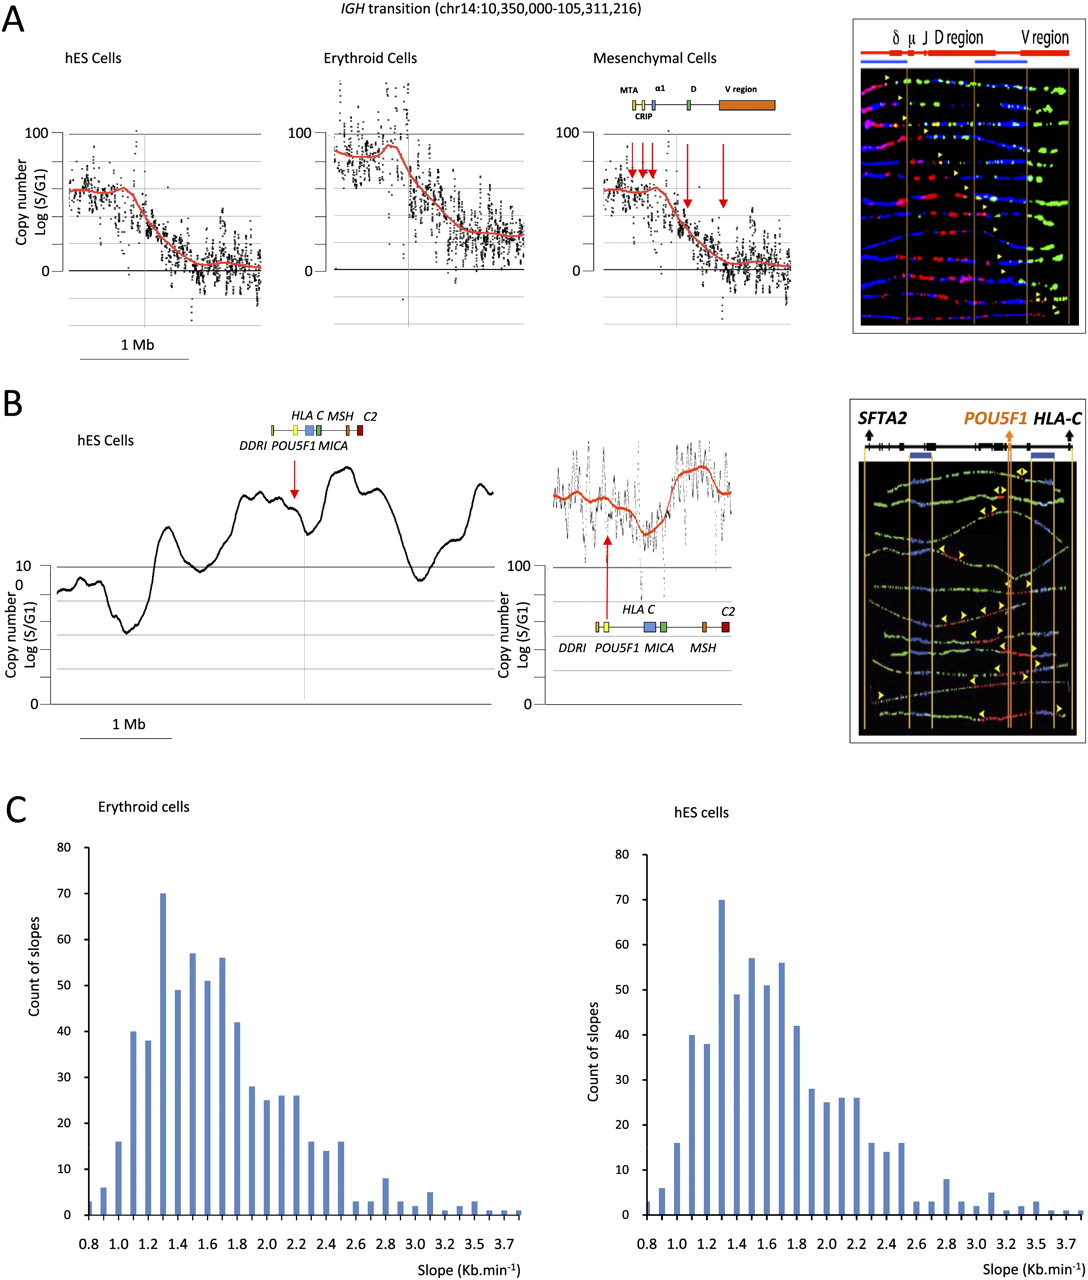
SMARD analysis. (A) The IGH@ region. (Three left panels) Scatterplots of the results of TimEX analysis in the IGH locus in basophilic erythroblasts, mesenchymal cells, and undifferentiated hESC. The black dots represent the S/G1 ratio using Gaussian convolution windows of 5 kb. The red curve shows the same data smoothed using windows of 200 kb. (Right panel) The SMARD analysis in human mesenchymal cells for a 161-kb PmeI segment of the IGH@ locus that is within the predicted transition region. All of the molecules are stained red at the left end (3′) and green at the right end (5′), indicating that in these mesenchymal stem cells a single replication fork proceeds from 3′ to 5′ (from early to late in S) continuously through the PmeI fragment analyzed at the IGH locus. A genomic map is included above the segment. The blue bars indicate the positions of the two blue biotinylated probes used to identify the segment by FISH (see Supplemental Fig. S8). The vertical orange lines delineate the location of the gene on the segment. The other vertical orange lines indicate the boundaries of the FISH probes. The yellow arrowheads indicate the direction in which the replication fork moves. These results validate the TimEX analysis and demonstrate a long transition region in the human IGH@ locus similar to the one previously reported in the mouse Igh region. (B) The POU5F1 region. (Two left panels) Scatterplots of the results of TimEX analysis in the POU5F1 region in hES cells. The panel to the left represents 6 Mb, the middle panel, 400 kb. Smoothing is as above. This TimEX profile suggests that this region is rich in origins, since replication seems to occur within the first hour of S over a 1-Mb segment. The panel to the right illustrates a SMARD analysis of a 350-kb segment containing the POU5F1 gene. A map of the 350-kb POU5F1 segment is shown above the image. As expected, (yellow) forks going in both directions can be detected in many molecules, suggesting that the region is indeed rich in origins. (C) Histograms illustrating the slope of the transition regions larger than 250 kb calculated genome-wide for hESC and erythroid cells. The method to calculate the slope is described in the Methods section.


