
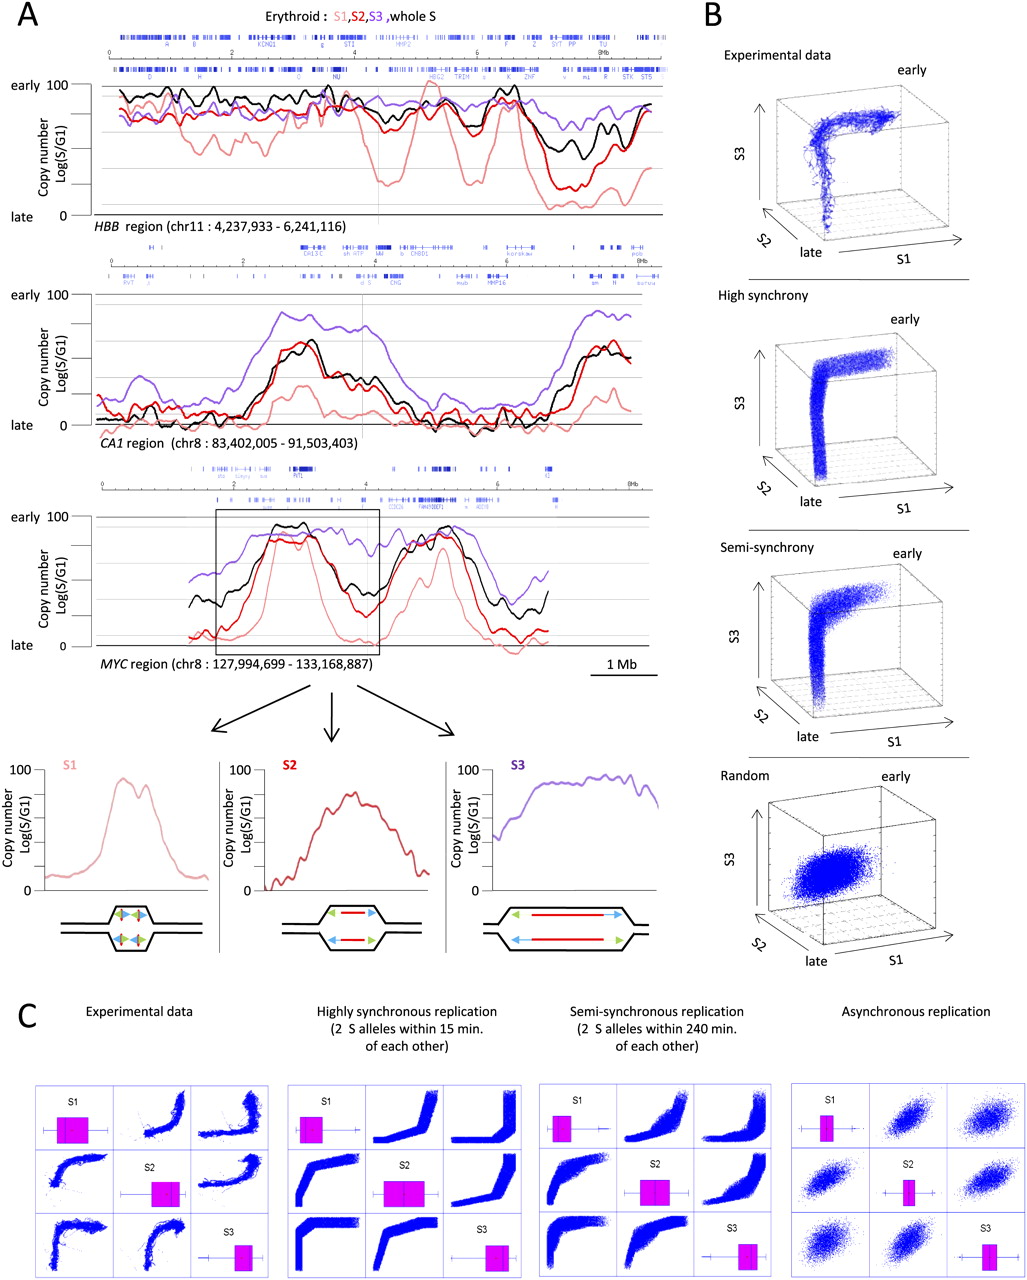
S-phase subfractionation experiments. (A) Scatterplots illustrating TimEX profiles for three genomic regions 5–8 Mb in size. The black curve represents the results for the entire sorted S phase; the pink, red, and purple curves the profiles for the early, middle, and late fractions, respectively. As expected, the profile of the whole S fraction resembles the average of the three fractions. The timing of replication varies over large domains. Analysis of these curves suggests that replication is highly regulated. (Bottom) Our molecular interpretation of one of the two major peaks observed in the myc region. Blue and green arrows represent progressing forks of replication; (red lines) newly replicated DNA. (B, top) Three-dimensional scatterplots illustrating the experimental S/G1 ratio of the early, middle, and late (S1/S2/S3) fractions plotted for all 10-kb genomic windows represented in the array. The three panels below illustrate the S1/S2/S3 scatterplots obtained from simulations in which the replication is assumed to be perfectly synchronous, semisynchronous, or asynchronous (see text, movies M1–M4, and Supplemental Fig. S9 for more plots and the algorithms used for the simulations). The experimental data are most similar to the synchronous replication model, suggesting that the order in which DNA is replicated during S phase is highly regulated. (C) Two-dimensional projections of the three-dimensional plots of B.


