
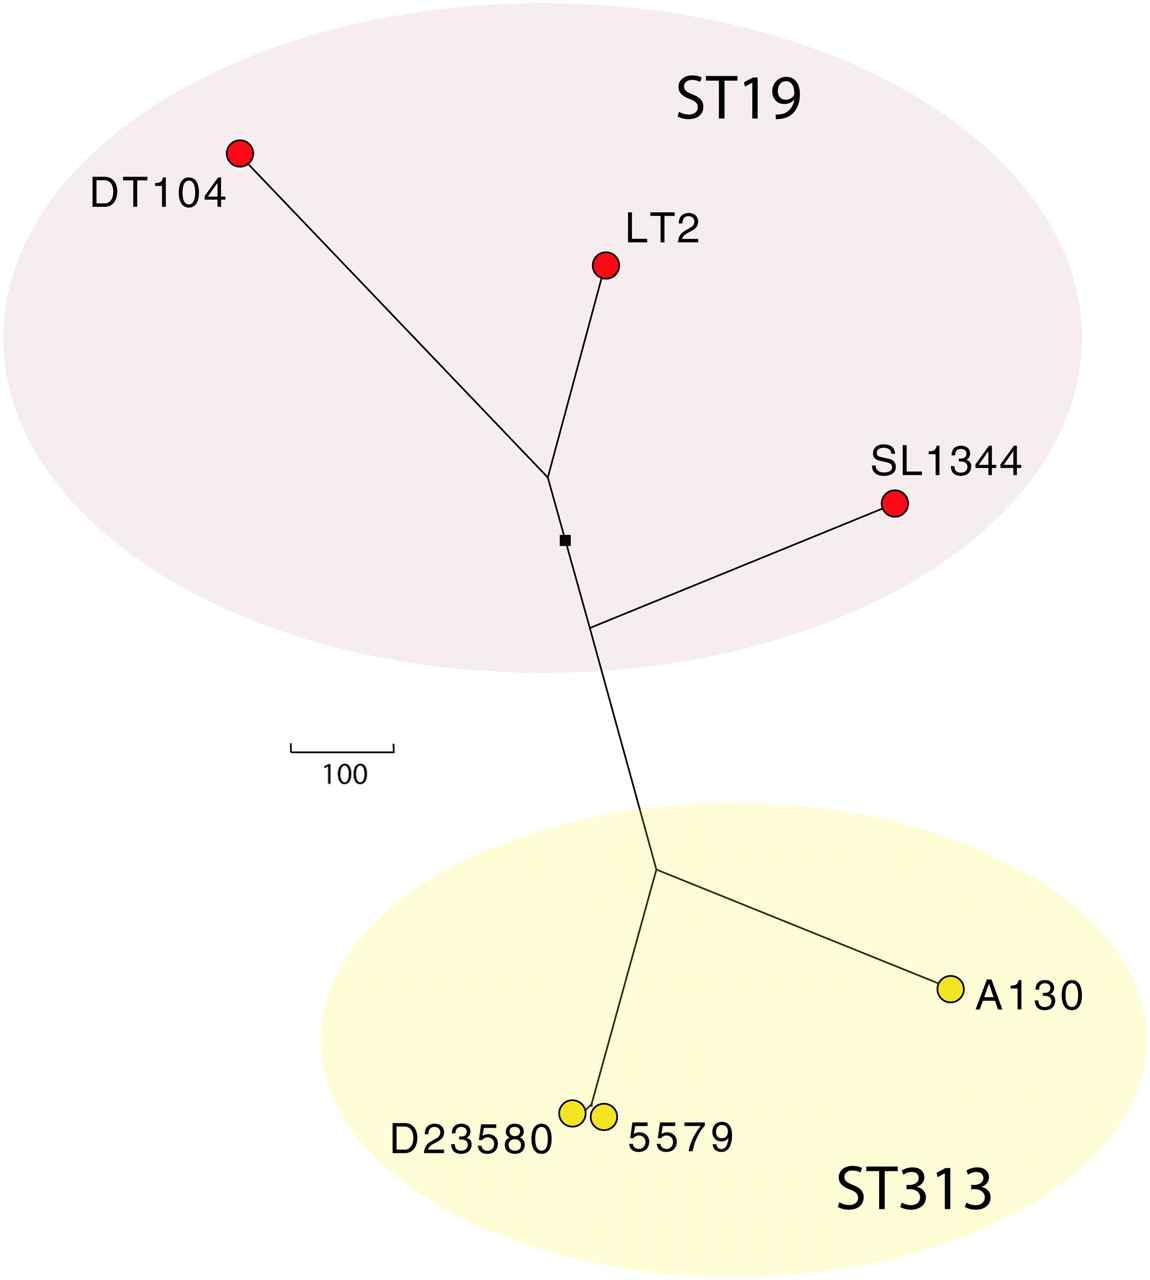
Figure 3.
Radial phylogram based on chromosomal SNPs showing the phylogenetic relationship of sequenced S. Typhimurium isolates. Branch lengths indicate the number of SNPs, scale as indicated, separating the sequenced isolates indicated by circles. ST19 isolates (red circles) and ST313 isolates (yellow circles) are shown. The black square indicates the ancestral root.


