
Abstract
Bioethanol is a biofuel produced mainly from the fermentation of carbohydrates derived from agricultural feedstocks by the yeast Saccharomyces cerevisiae. One of the most widely adopted strains is PE-2, a heterothallic diploid naturally adapted to the sugar cane fermentation process used in Brazil. Here we report the molecular genetic analysis of a PE-2 derived diploid (JAY270), and the complete genome sequence of a haploid derivative (JAY291). The JAY270 genome is highly heterozygous (∼2 SNPs/kb) and has several structural polymorphisms between homologous chromosomes. These chromosomal rearrangements are confined to the peripheral regions of the chromosomes, with breakpoints within repetitive DNA sequences. Despite its complex karyotype, this diploid, when sporulated, had a high frequency of viable spores. Hybrid diploids formed by outcrossing with the laboratory strain S288c also displayed good spore viability. Thus, the rearrangements that exist near the ends of chromosomes do not impair meiosis, as they do not span regions that contain essential genes. This observation is consistent with a model in which the peripheral regions of chromosomes represent plastic domains of the genome that are free to recombine ectopically and experiment with alternative structures. We also explored features of the JAY270 and JAY291 genomes that help explain their high adaptation to industrial environments, exhibiting desirable phenotypes such as high ethanol and cell mass production and high temperature and oxidative stress tolerance. The genomic manipulation of such strains could enable the creation of a new generation of industrial organisms, ideally suited for use as delivery vehicles for future bioenergy technologies.
As concerns mount over the alarming effects of climate change and of the continued volatility in petroleum markets, nations throughout the world are increasingly adopting policies to promote the use of renewable and domestic sources of energy (Robertson et al. 2008). Among the most viable alternatives, bioethanol stands out as a benchmark biofuel because its production is based on a proven technological platform. Bioethanol is produced through microbial fermentation of carbohydrates derived from agricultural feedstocks, mainly starch and sucrose. While the United States and Brazil are the dominant players in bioethanol, sharing ∼70% of the global market, their production systems differ in many respects (Sanderson 2006; Goldemberg 2007). North American bioethanol is currently produced from enzymatically hydrolyzed starch from grains. Farming this type of feedstock is energy-intensive, resulting in a final energy balance that is only marginally positive. This process is currently regarded as a transitional technology, which in the coming years is expected to give way to advanced cellulosic biofuels (Gura 2009). The Brazilian system uses sugar cane as feedstock, a tropical grass crop that abundantly accumulates sucrose that can be converted to bioethanol directly by the yeast Saccharomyces cerevisiae without enzymatic pre-treatment. Among other advantages, sugar cane is semiperennial and has symbiotic interactions with nitrogen-fixing microorganisms, allowing this system to produce an energy surplus estimated at about eightfold (Goldemberg 2007; Robertson et al. 2008).
In the microbial fermentation process used in Brazil, the yeast inoculum is often recycled from one fermentation tank to the next (Wheals et al. 1999). In many distilleries, this recycling spans the entire 8-mo sugar cane harvesting season (Basso et al. 2008), imposing both biotic and abiotic stresses on the fermenting yeast strain. While yeast strains genetically bred for high efficiency in fermentation have been available since the 1980s (Tavares and Echeverrigaray 1987), they are often outcompeted in the industrial environment by more robust “wild” yeasts that contaminate the sugar cane stalks (Wheals et al. 1999; da Silva et al. 2005). In the 1990s, an alternative strategy was adopted: selection among the wild yeast contaminants for those that combined high fermentation efficiency with prolonged persistence in the system. In recent years, such strains have been widely adopted by the industry. One of the most successful examples is the PE-2 wild isolate (Basso et al. 2008), currently used by ∼30% of Brazilian distilleries, generating ∼10% of the world's bioethanol supply.
Thirteen years ago, the S. cerevisiae laboratory strain S288c became the first eukaryote to have its genome completely sequenced (Goffeau et al. 1996). Since then, other haploid strains from diverse backgrounds have been sequenced (RM11-1a, YJM789, M22, YPS163, and AWRI1631; S. cerevisiae RM11-1a Sequencing Project; http://www.broad.mit.edu/) (Wei et al. 2007; Borneman et al. 2008; Doniger et al. 2008), and more recently a large-scale effort to determine the genome sequences of many others has been completed (Liti et al. 2009).
Extensive analysis has been done to examine the nucleotide sequence diversity between these strains (Liti et al. 2009; Schacherer et al. 2009), whereas studies of structural variation have mostly focused on comparisons of S. cerevisiae to other related species (Fischer et al. 2000; Goffeau 2004; Scannell et al. 2007; Gordon et al. 2009). Microarray-based whole-genome hybridization studies of wild, industrial, and laboratory S. cerevisiae strains (Winzeler et al. 2003; Carreto et al. 2008; Faddah et al. 2009; Schacherer et al. 2009) have uncovered a recurrent pattern of copy number variation (CNV) near the ends of chromosomes, suggesting a role for repetitive DNA sequences in structural genome diversification. Despite these valuable insights, two central questions regarding the role of chromosomal rearrangements in genome evolution in S. cerevisiae remain unanswered: First, it is still unclear how these rearrangements contribute to long-term fitness in natural environments; and second, it is not known if they are compatible with the formation of viable meiotic spores that would allow their sexual dissemination between natural S. cerevisiae populations.
In this study, we report a detailed molecular genetic characterization of a PE-2 derived diploid (JAY270) and the complete genome sequence of a derived haploid (JAY291). We have found extensive structural differences between the genome of JAY270 and those of other sequenced S. cerevisiae strains, including chromosomal translocations and insertions of large blocks of DNA absent in the reference strain's genome. These differences were confined to the peripheral regions of the chromosomes, while the central portions have remained structurally conserved. This pattern of structural variation was fully compatible with the formation of viable meiotic spores, and in some cases, the chromosome rearrangements resulted in the amplification of genes implicated in environmental stress tolerance. This observation supports a model in which S. cerevisiae chromosomes are organized in two structural domains (Pryde et al. 1997). Our data suggest a general chromosome organization in which the central core sectors, harboring the essential genes, are refractory to rearrangements, while the peripheral regions are highly plastic and are free to undergo ectopic recombination.
Results
Genetic and phenotypic characterization
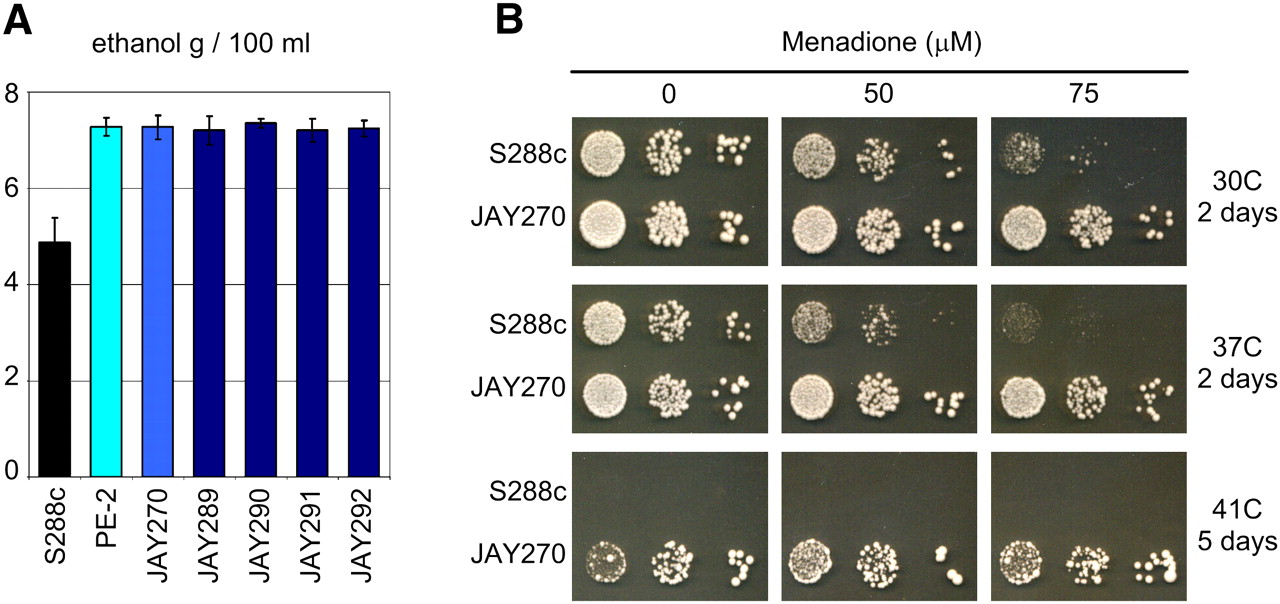
Before initiating a detailed characterization of PE-2, we used pulsed-field gel electrophoresis (PFGE) to show that the commercially available stocks of this strain contain a mixture of cells that have slightly diverged karyotypes (Supplemental Fig. 1). Consequently, we purified a single colony isolate with a representative karyotype. This isolate, JAY270, was indistinguishable from the original PE-2 culture in phenotypic tests (Fig. 1A; data not shown) and was used in all subsequent experiments.
Comparative phenotypic analysis of JAY270 and S288c. (A) Sugar cane extract fermentation assays (∼18% sucrose). The ethanol concentration shown is the average reached in four fermentation assay repetitions, each comprised of four consecutive 15 h of fermentation at 30°C with cell recycling (see Methods for details). (B) Reactive oxygen (menadione) and temperature effects on colony growth. Tenfold serial dilutions of saturated cultures spotted (5 μL) in rich medium (YPD) containing various concentrations of menadione were incubated at the indicated temperatures and scanned after the indicated incubation period. The S288c-isogenic control strain used in A was the BY4741 haploid and in B was the JAY309 diploid.
Upon induction of meiosis, JAY270 displayed rapid and efficient sporulation, producing mostly asci with four ascospores. We dissected 104 tetrads and observed four viable spores per tetrad in 88 (93.3% spore viability). By PCR analysis, we found 2:2 segregation at the mating type locus (MAT) (data not shown). These results show that JAY270 is a diploid, does not contain recessive lethal mutations, and is not heterozygous for chromosome aberrations that span essential genes. The haploid segregants derived from JAY270 had stable MATa or MATα genotypes, indicating that the strain is naturally heterothallic. We crossed haploid strains (both MATa and MATα) derived from JAY270 to S288c-derived strains of the opposite mating type. The hybrid diploids produced in these crosses sporulated normally, had high spore viability (75%–95%), and exhibited Mendelian segregation for all auxotrophic markers from the S288c-derived parent. These results argue that the chromosome structure of JAY270 is mostly collinear with that of S288c, at least in the regions required for viability.
We compared JAY270 and its derivatives to S288c in several phenotypic tests. In sugar cane extract fermentation assays that simulate the conditions found in the industry (Fig. 1A), JAY270 and all four spore clones from a JAY270 tetrad (segregants JAY289, JAY290, JAY291, and JAY292) produced roughly 50% more ethanol than the S288c strain. The observation that all four spore clones were equally proficient in ethanol production argues that the major alleles contributing to this complex phenotype are homozygous in the JAY270 diploid. We also compared growth phenotypes under a variety of stress conditions. Tolerance to ethanol, acid washing, and short-term heat killing were not differently affected in these strains (Supplemental Fig. 2); however, JAY270 was much more tolerant to oxidative stress and high-temperature growth than S288c (Fig. 1B). When grown in the presence of menadione, an inducer of reactive oxygen species, JAY270 grew normally at concentrations that were inhibitory to S288c. JAY270 was also highly tolerant to temperature stress. While S288c had reduced growth rates at 37°C and did not form isolated colonies at 41°C, JAY270 formed larger colonies at 37°C than it did at 30°C (Supplemental Fig. 3). At 41°C, JAY270 displayed slower growth but maintained full viability. These traits are likely important for long-term viability and competitiveness in the industrial setting, where oxidative stress (Landolfo et al. 2008) and heat are generated during high-pitch fermentation (fermentation involving large inocula).
Finally, we examined the patterns of genetic inheritance associated with two of the most important industrial traits of JAY270: cell mass accumulation and kinetics of ethanol production. To bypass the influence of factors specific to sugar cane extract (e.g., sucrose utilization), the fermentations were carried out in rich media with 10% glucose. We mated an S288c-isogenic strain to a haploid spore derived from JAY270 (JAY291) and generated hybrid diploids. Two reciprocal F1 generation diploids (JAY361 and JAY365) were created by mating ρ0 mitochondrial petites derived from either parent (Fox et al. 1991). These two diploids were phenotypically indistinguishable from each other (data not shown), indicating that differences between the mitochondrial genomes of S288c and JAY291 do not have a major influence on the traits examined. We then evaluated the JAY291 and S288c haploid parents and the F1 hybrid JAY361 in time-course fermentations. JAY291 displayed a higher growth rate and finished the fermentation with a cell density 34% higher than S288c; the JAY361 hybrid had an intermediate phenotype (Fig. 2A). Under the conditions used in this assay, all three strains reached the same final concentration of ethanol at the end of the fermentation (Fig. 2B), but JAY291 and JAY361 were much more efficient, displaying higher kinetics of ethanol production and requiring ∼30% less time than S288c to complete the fermentation. We have not tested diploidized versions of the JAY291 and S288c parents in these assays; therefore, we cannot firmly ascertain dominance effects associated with these traits. However, if ploidy is not an influencing factor, our results would suggest that the cell mass accumulation trait is semidominant, whereas the kinetics of the ethanol production trait is fully dominant.
Genetic analysis of cell mass accumulation and ethanol production kinetics. (A) Kinetics of cell mass accumulation and (B) ethanol production during fermentation of rich media with 10% glucose. The results show the average values and standard error for three biological replicates from each strain. The S288c-isogenic strains used in these assays were the MATα haploids S1 (ρ+) and S97 (ρ0). The JAY361 diploid was obtained by mating JAY291 and S97; this diploid inherited 100% of its mitochondrial genome from JAY291. (C) The distributions of cell mass accumulation after 18 h and (D) ethanol production after 8 h among haploid F2 spores derived from JAY361. F2 individuals were grouped in bins according to their phenotypes, and the bars represent the number of individuals in each phenotypic bin. (E) Scatterplot of cell density (x-axis) versus ethanol concentration (y-axis) for all F2 individuals tested in both assays (gray dots). The relative phenotypes of (P1) JAY291, (F1) JAY361, and (P2) S1. n is the number of F2 individuals in each data set, H2 is the broad-sense heritability calculated from phenotypic and environmental variances, and r2 is the coefficient of correlation between the two traits analyzed. Only data from non-flocculant F2 individuals were used in this analysis.
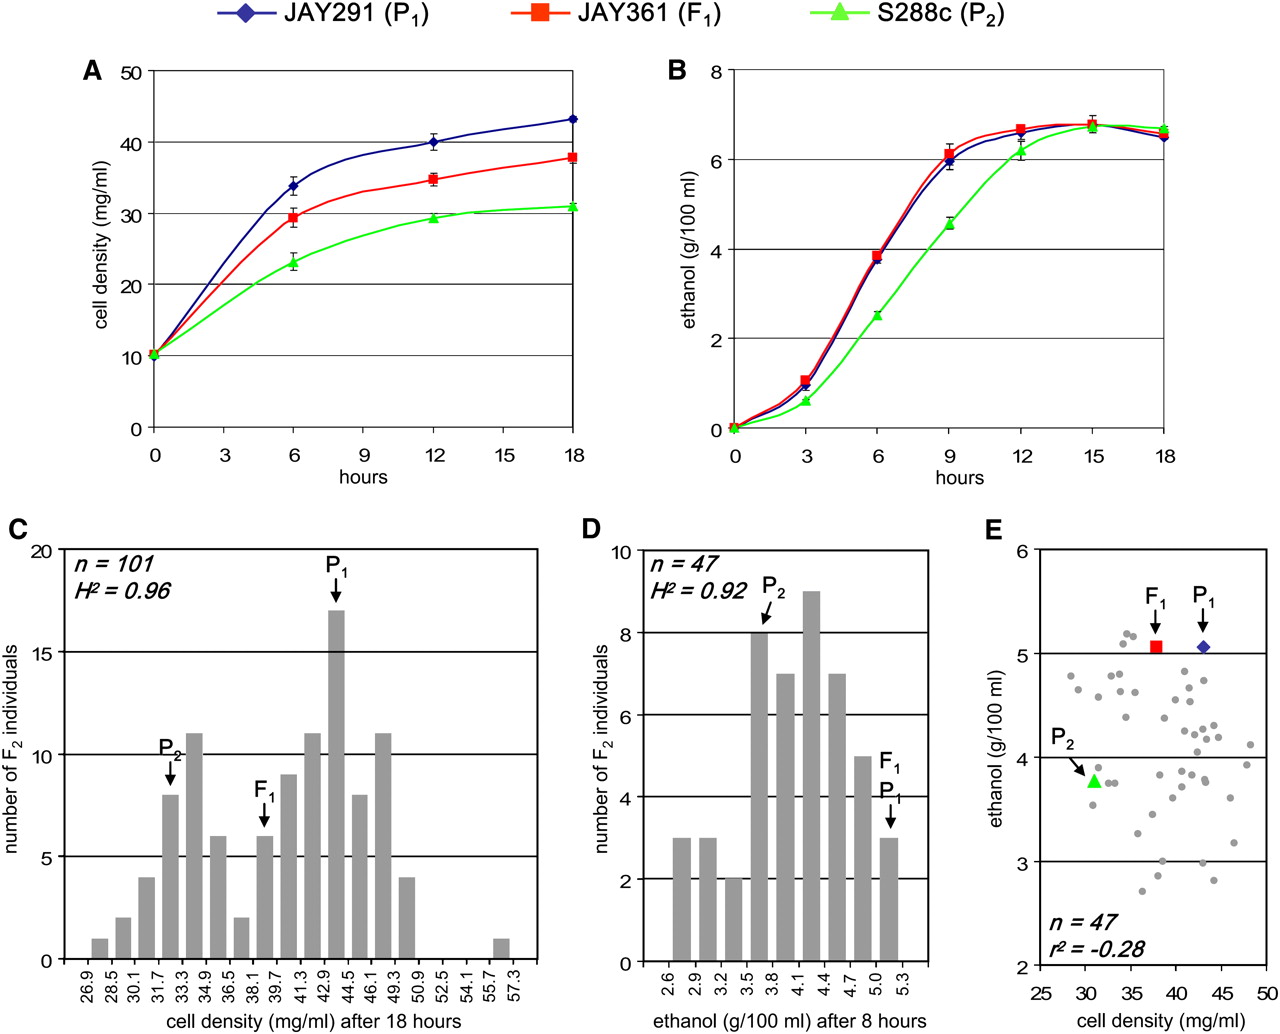
We sporulated and dissected asci from JAY361 to isolate F2 haploids segregating genomic segments from the two parent strains. Individual clones in this progeny were then examined for final cell mass accumulation and ethanol concentration after 8 h of fermentation (the point of highest differential between the parents) as an indicator of ethanol production kinetics. The phenotypic distributions for these two traits in the progeny were quite distinct and gave preliminary indications of the genetic control associated with each. The distribution of cell mass accumulation (Fig. 2C) appeared to be bimodal, with two distinct peaks centered around the phenotypes of the parents and a valley that corresponded roughly to the phenotype of the F1 hybrid. One interpretation of this pattern is that it was created by segregation of the two alleles of a single gene that is the major determinant of the cell mass accumulation phenotype. In addition to this major locus, the segregation of other minor contributing alleles was responsible for the bell-shaped distribution around each peak. The distribution of ethanol production kinetics (Fig. 2D) was more typical of a quantitative trait controlled by loci with roughly equal contributions to the phenotype. From this limited initial analysis, we can estimate that three or four genes are responsible for the segregation pattern observed for ethanol production kinetics.
We also asked whether there is a correlation between cell mass accumulation and ethanol production kinetics. This analysis (Fig. 2E) suggested that the two traits are largely independent of each other and are presumably controlled by different genes. The calculated broad-sense heritabilities associated with both traits were very high (H2 > 0.90), indicating that most of the phenotypic variance observed between F2 individuals was due to differences in genetic composition.
Molecular karyotype analysis
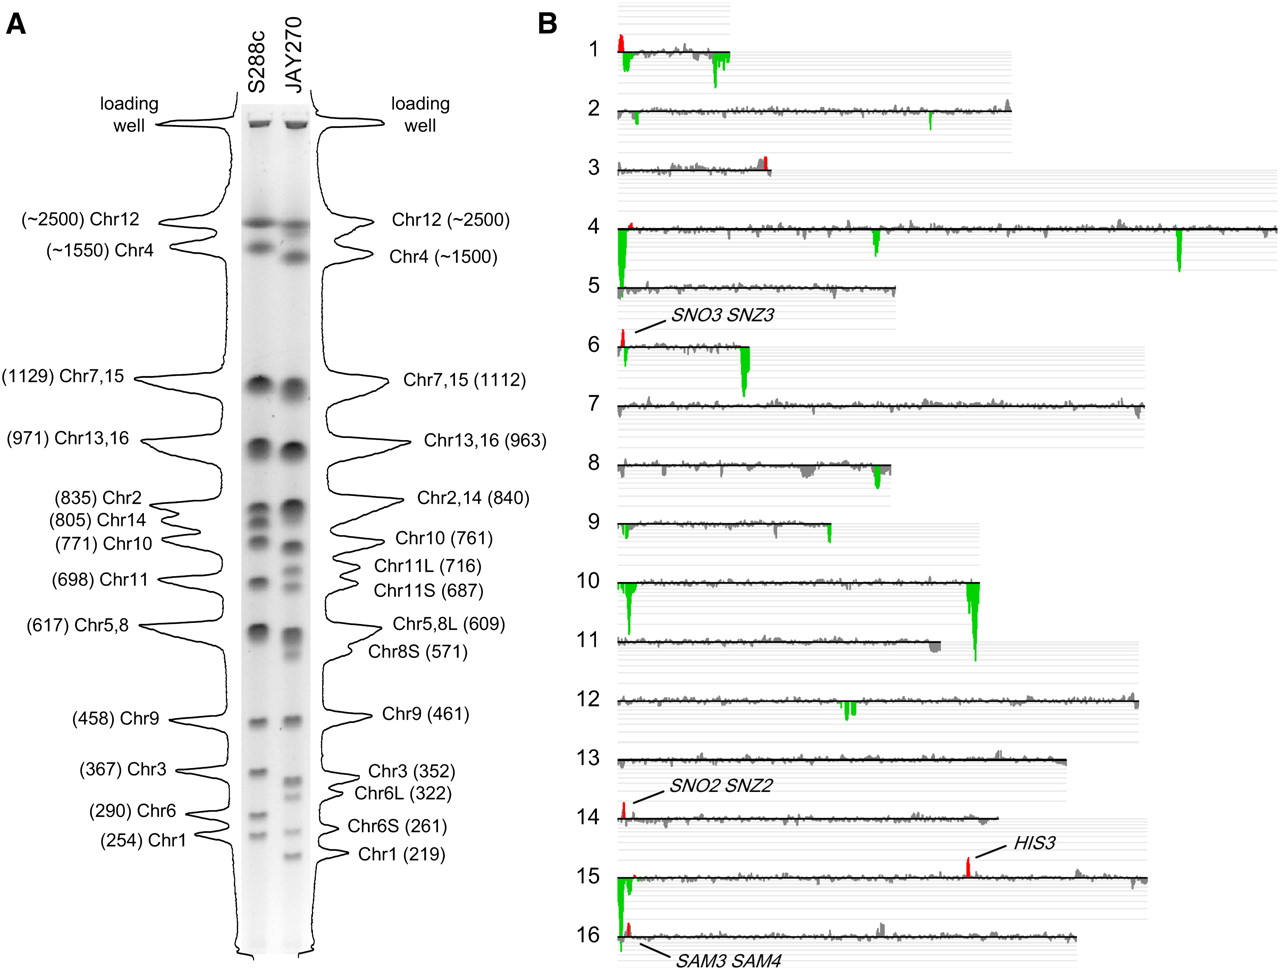
We compared the molecular karyotypes of JAY270 and S288c using a combination of PFGE, and microarray-based comparative genomic hybridization (CGH-array) and band-array (Argueso et al. 2008). PFGE analysis revealed clear chromosome (Chr) length polymorphisms between S288c and JAY270 (Fig. 3A). This analysis also showed polymorphisms between several pairs of homologs within the JAY270 diploid. Image tracing of the separated chromosomes in JAY270 revealed that some chromosomes were represented by two bands, each present in one copy in the diploid. For example, Chr6 is represented by short (Chr6S) and long (Chr6L) homologs, differing in size by ∼60 kb. Interestingly, karyotypic analysis of the meiotic haploid spores revealed parental-sized chromosomes in JAY289 and JAY290, and chromosomes with the sizes expected for reciprocal recombinants between Chr6S and Chr6L in JAY291 and JAY292 (Fig. 4A, second band from the bottom). In addition to Chr6, at least Chr3, Chr5, Chr9, Chr11, Chr14, and either Chr7 or Chr15 had length polymorphisms between homologs in JAY270.
Molecular karyotype and gene CNV in JAY270. (A) PFGE and densitometric analysis of individual chromosomal bands in S288c and JAY270. The size of the peaks reflects the intensity of the ethidium bromide staining for each chromosomal band as determined by image analysis using Bio-Rad QuantityOne software. The predicted chromosome sizes (in kilobases) shown next to the corresponding chromosomal peaks were determined by comparison to the Bio-Rad l molecular weight ladder (data not shown). Note the presence of different-sized homologs for Chr6 and Chr11 that appear at lower relative intensities. Contrast the abundance of each Chr6 homolog to the intensity of Chr3 for which both homologs are about the same size, and compare the abundance of each Chr11 homolog to the intensity of Chr10. (B) CGH-array relative gene dosage plots. Each horizontal line corresponds to a specific S288c chromosome; the signal of each array probe was smoothed in CGH-miner software in a seven-probe sliding window to reduce noise (Wang et al. 2005). (Gray areas) Regions of similar genomic dosage; (positive/red peaks) genomic regions overrepresented; (negative/green peaks) genomic regions underrepresented. The amplification signal on the left end of Chr1 included the SEO1 gene encoding a putative amino acid permease; the amplification peak on the right end of Chr3 did not include any known genes; all other amplifications are discussed in the text. None of the deletion/underrepresentation peaks spanned regions containing genes known to be essential in S288c. The S288c-isogenic control strain used in A and B was the JAY309 diploid.
Molecular karyotype of meiotic products and segregation of chromosomal rearrangements. (A) Ethidium bromide staining of a PFGE including the four meiotic spore clones from a JAY270 tetrad. The S288c-isogenic control strain used was the JAY309 diploid. Southern hybridizations of the PFGE in A using as probes the (B) AGP3, (C) YAR064W, and (D) SNO/SNZ sequences that were PCR-amplified from S288c genomic DNA. The SNO/SNZ (2-3) probe detects only the duplicated SNO2, SNZ2, SNO3, and SNZ3 genes. The diverged single-copy genes SNO1 and SNZ1 on Chr13 are not detected. The numbers to the left indicate the S288c chromosomes to which these probes hybridized. The YAR064W gene is duplicated in S288c and JAY270 at the right end of Chr8.

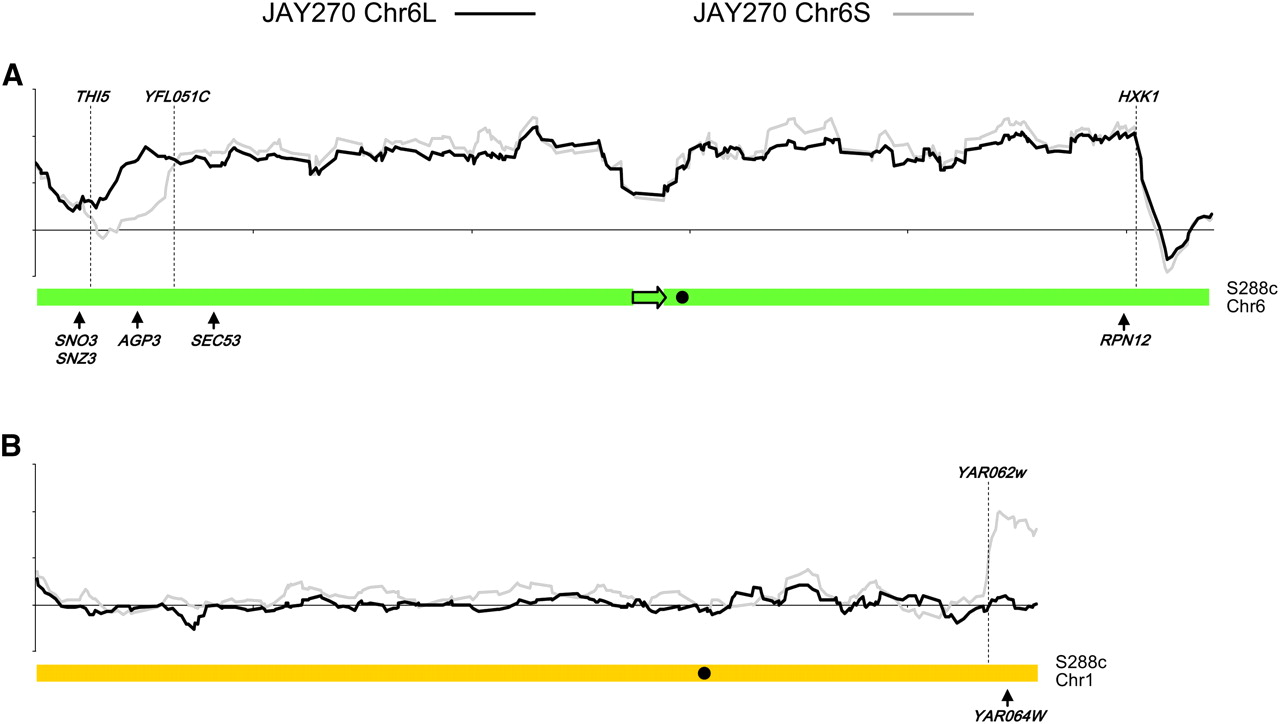
We examined the structural polymorphisms between the Chr6 homologs by excising their respective chromosomal bands from PFGE, labeling the DNA, and hybridizing them to microarrays covering the entire S288c reference genome (band-array; Fig. 5). The JAY270 Chr6 homologs differed from each other and from Chr6 in S288c only near the chromosome ends, in regions distal to the first and last essential genes (SEC53 and RPN12). This analysis showed that Chr6L contained an ∼16-kb region on the left arm that was missing in Chr6S (including the AGP3 gene), and that Chr6S contained an ∼12-kb translocation from the right arm of Chr1 (including the YAR064W gene) that was missing in Chr6L. Southern analysis (Fig. 4B,C) confirmed this arrangement and revealed an additional translocation involving AGP3 on one of two Chr10 homologs of JAY270. Notably, the cumulative band-array hybridization signal for Chr6L (∼322 kb in size; Fig. 2A) accounted for only ∼250 kb of sequence, suggesting the presence of ∼70 kb of DNA that did not hybridize to the microarrays.
Band-array analysis of Chr6L and Chr6S homologs in JAY270. The curves indicate the normalized hybridization signal of specific chromosomal DNA samples (y-axis) to probes arranged according to their chromosomal coordinates (x-axis) in S288c (A) Chr6 and (B) Chr1. The dashed vertical lines indicate the breakpoints where JAY270 Chr6S and Chr6L differ from each other and from the S288c chromosomes. Only the data for Chr6 and Chr1 probes are shown. No hybridization signal was detected for other S288c chromosomes, with the exception of the right end of Chr8, which is essentially identical to Chr1. SEC53 and RPN12 indicate the most distal essential genes in S288c Chr6, and SNO3, SNZ3, AGP3, and YAR064W indicate the position of Southern blot probes used in Figure 4. The signal valley in the central position of Chr6 corresponds to the position of the YFLWTy2-1 retrotransposable element (arrow) that is not present in the JAY270 Chr6 homologs. (Black circles) Centromere positions.
We used CGH-arrays to look for sequences that were missing or duplicated in JAY270 relative to S288c (CNVs; Fig. 3B). Most regions of the genome were present in equal doses between these strains. The regions in Figure 3 shown in green near the telomeres of Chr1, Chr4, Chr6, Chr10, and Chr15 were underrepresented in the JAY270 genome. These could be either missing in JAY270 or represent diverged sequences that do not hybridize to the S288c-based microarrays. The underrepresented regions that were not telomeric corresponded to regions containing tandemly repeated genes in S288c (HXT7, HXT6, HXT3, and ENA5, ENA2, ENA1 in Chr4, and ASP3-1 to ASP3-4 in Chr12) that likely contracted in JAY270 or expanded in S288c as a consequence of unequal crossing over; the regions shown in red represent sequences that were amplified in JAY270 relative to S288c. An amplification signal detected in the central section of Chr15 corresponded to the HIS3 marker locus. This gene is present in JAY270 but was intentionally deleted in the derivative of S288c that was used in the CGH-array experiments. Thus, we can effectively detect a single amplified gene by these methods.
The amplification at the left end of Chr16 spans the SAM3 and SAM4 genes that are involved in the metabolism of S-adenosylmethionine (AdoMet), a key biochemical cofactor that participates in a variety of metabolic pathways. The Sam4p has been proposed to participate in the recycling of AdoMet from the inactive, and possibly toxic, (R,S)-AdoMet isomeric state back to the biologically essential form (S,S)-AdoMet (Vinci and Clarke 2007). Based on CGH-array and Southern blot data (Fig. 3B; data not shown), we estimate that four copies of these genes are present in JAY270 compared to two in the laboratory diploid strain.
Another interesting gene amplification resulted in two peaks at the left ends of Chr6 and Chr14. In S288c these regions contain, respectively, the duplicated SNO3 and SNZ3, and SNO2 and SNZ2 genes, which are involved in vitamin B6 metabolism and have a role in oxidative stress tolerance (Padilla et al. 1998; Ehrenshaft et al. 1999; Rodriguez-Navarro et al. 2002). To determine the extent and chromosomal distribution of the SNO/SNZ gene amplifications in JAY270, we did a Southern analysis of pulsed-field gels for this region (Fig. 4D). We detected nine copies of the SNO/SNZ genes in JAY270, compared to four in the S288c diploid. Consistent with this observation, we found that expression levels of these genes were up-regulated about fourfold in JAY270 relative to S288c (Supplemental Table 1). These results also showed that SNO/SNZ genes were redistributed among the chromosomes in JAY270 with no copies on either Chr6 homolog and new copies on Chr9, Chr10, Chr13 or Chr16, Chr7 or Chr15, and Chr4 (Fig. 4D). Strikingly, three of the extra copies were hemizygous (only one copy of a gene is present in a pair of homologous chromosomes) in the JAY270 diploid as could be inferred from their Mendelian segregation among the haploid spores JAY289–JAY292.
Genome sequencing of JAY291, a haploid spore derived of JAY270
In addition to the molecular genetic analysis described above, we used massively parallel DNA sequencing to characterize the genome of JAY270. To avoid complications due to heterozygosity in the diploid, we sequenced the genome of a haploid derivative, JAY291. Two independent DNA sequencing platforms were used, 454 Life Sciences (Roche) and Illumina, resulting in 162-fold coverage (Table 1). Despite this high level of redundancy, because both of these methods generated relatively short sequence reads (<250 bp), we were still unable to assemble the genome into one single contiguous sequence per chromosome. Instead, our de novo assembly of the JAY291 genome resulted in 452 genomic fragments (contigs; Methods). As expected, when we compared these contigs to the S288c reference genome, it became clear that most interruptions occurred at regions of dispersed repetitive DNA sequences, mostly Ty retrotransposon insertions. As described below, we compared the sequences of JAY291 to those of other sequenced S. cerevisiae strains: S288c, RM11-1a, and YJM789 (Wei et al. 2007). These sequence comparisons were done to characterize chromosome structure differences between these strains, as well as to determine the level of nucleotide sequence divergence.
Summary of JAY291 genome sequencing and assembly parameters
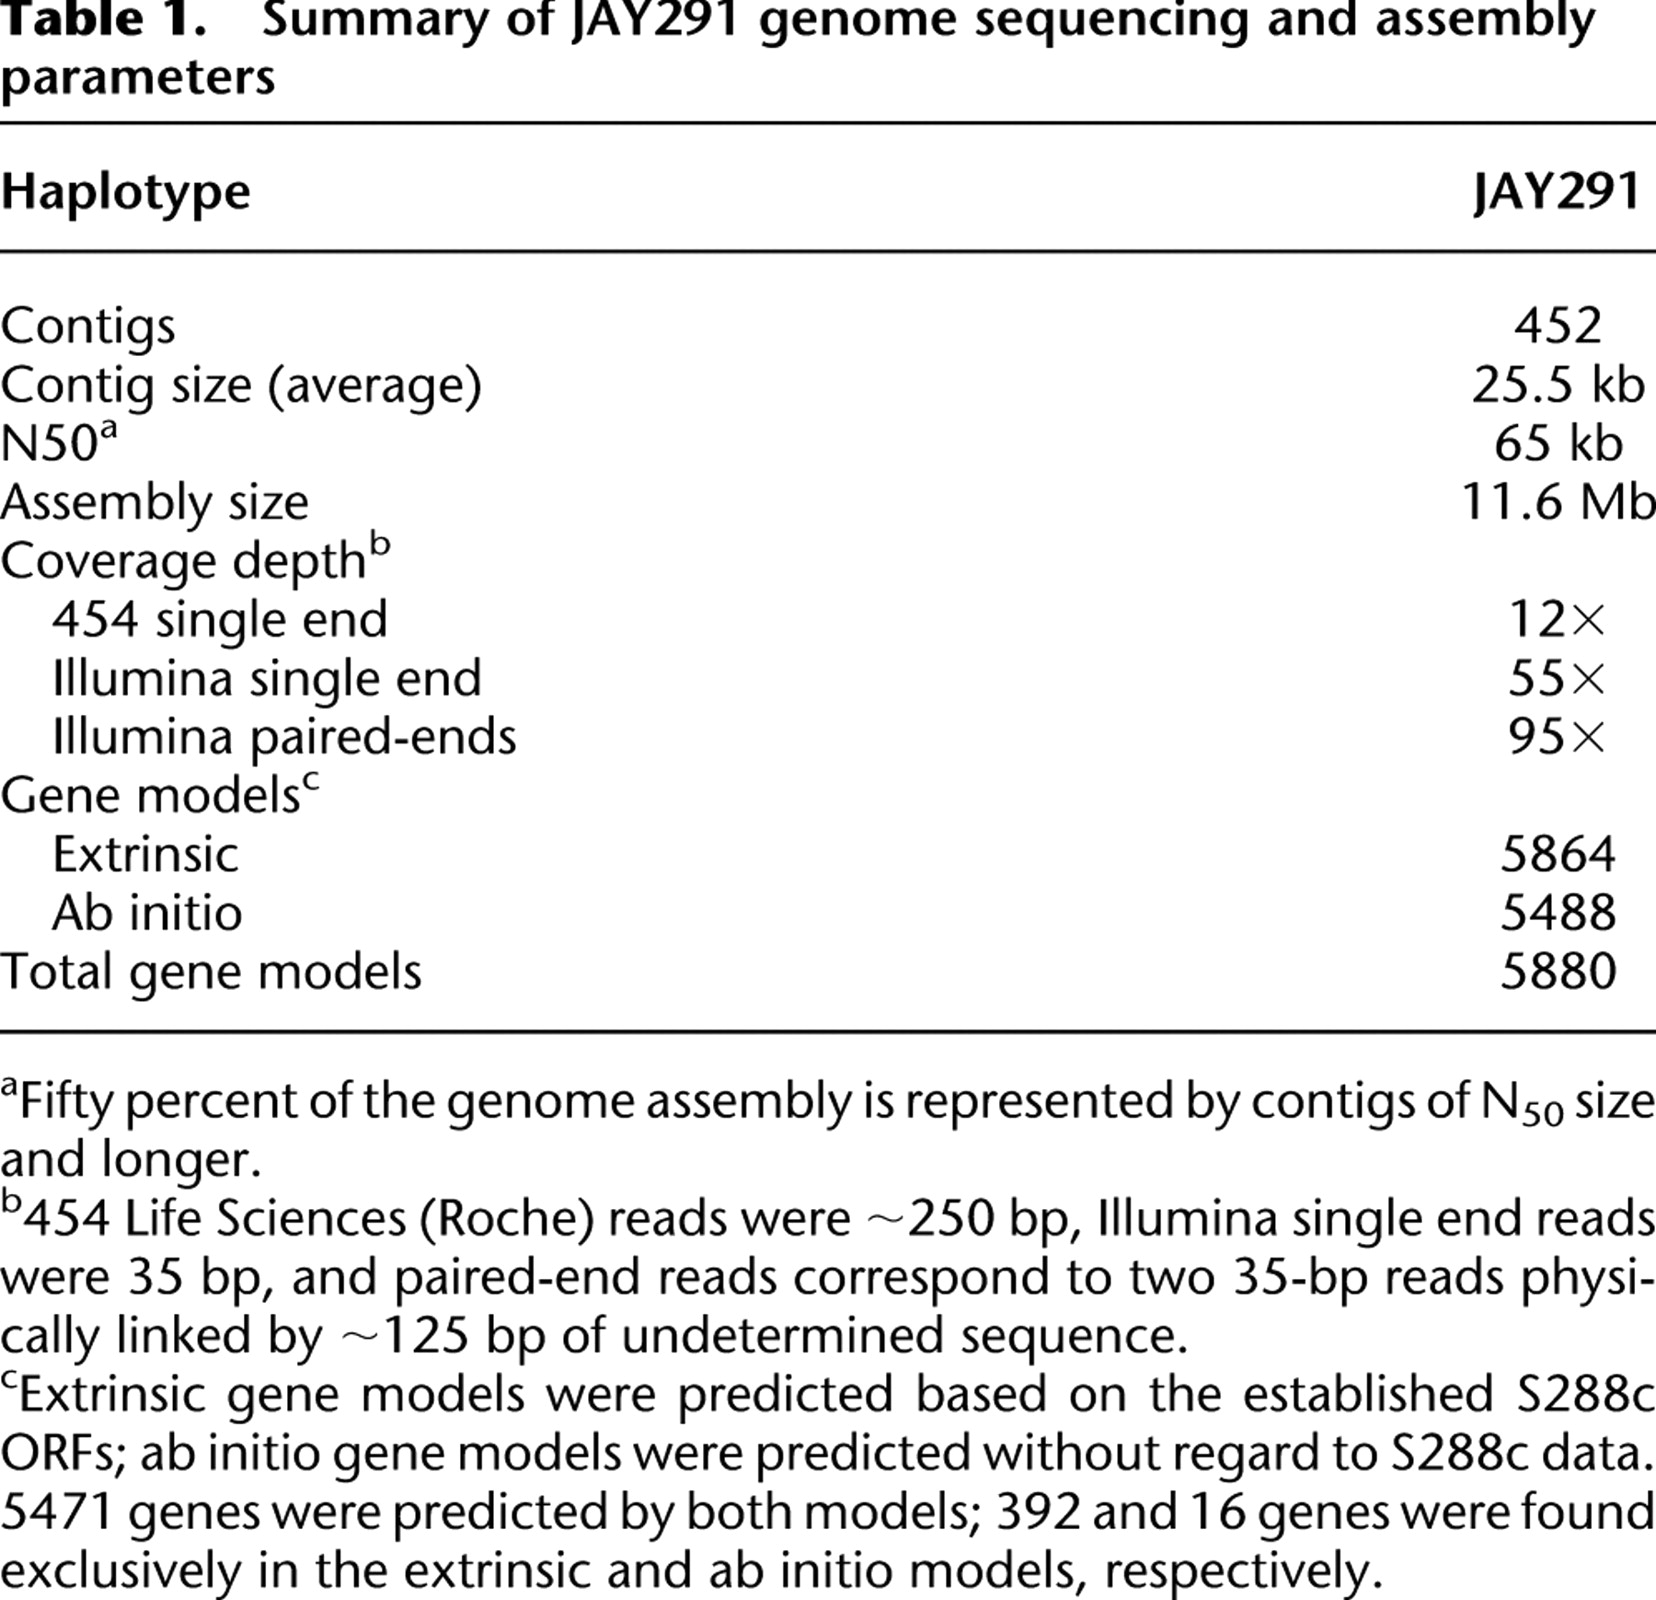
[i] aFifty percent of the genome assembly is represented by contigs of N50 size and longer.
[ii] b454 Life Sciences (Roche) reads were ∼250 bp, Illumina single end reads were 35 bp, and paired-end reads correspond to two 35-bp reads physically linked by ∼125 bp of undetermined sequence.
[iii] cExtrinsic gene models were predicted based on the established S288c ORFs; ab initio gene models were predicted without regard to S288c data. 5471 genes were predicted by both models; 392 and 16 genes were found exclusively in the extrinsic and ab initio models, respectively.
Chromosome structure polymorphisms
From the PFGE profiles of JAY270 and its haploid descendents (Figs. 3A and 4A), it was clear that this diploid has chromosomes that vary in size, not only in comparison to S288c, but also between the two homologs. To investigate the nature of these rearrangements, we focused our analysis on Chr6. In JAY270, the two homologs were ∼261 kb (Chr6S) and ∼322 kb (Chr6L) in size. Chr6 of JAY291 is a recombinant between Chr6S and Chr6L and is ∼290 kb in size. We assembled the complete sequence of Chr6 in JAY291 by searching the 452 whole-genome contigs for known Chr6 sequences from the S288c, RM11-1a, and YJM789 strains; this search identified 14 candidate contigs. We then used PCR to amplify across the small gaps between the contigs and to position telomeric repeats, confirming their relative order and orientation (data not shown). The size of the resulting assembled sequences (including one X and one Y′ element as each telomere) was 290 kb, matching the observed PFGE size. The chromosome structure and nucleotide sequence in the central portion of Chr6 were very similar to those of S288c, whereas in the regions near the telomeres, the sequences were more diverged or completely different (Fig. 6A). At the left end of the Chr6 alignment, we found two segments (9.1 and 19.3 kb) that are absent in the S288c genome. We also aligned the JAY291 chromosome to the Chr6 sequence from Saccharomyces paradoxus (Kellis et al. 2003), the closest known relative of S. cerevisiae, and observed continual synteny through most of Chr6, including the entire left arm. This alignment suggests that the 9.1-kb and 19.3-kb insertions were present in the last common ancestor of S. cerevisiae and S. paradoxus and that they were probably lost from the progenitor of S288c. The only structural difference in the central section of Chr6 was a Ty2 retrotransposon element insertion that is present in S288c (YFLWTy2-1) but absent in JAY291. Chr6 had no full-length retrotransposons in JAY270, but Ty elements were found in all other chromosomes (Supplemental Fig. 4).
Genome rearrangements near the ends of chromosomes. (A) Full-length Chr6 sequences aligned with the Artemis Comparative Tool software (Carver et al. 2005). Red lines connect regions of sequence similarity higher than 85%; gaps in white lower or absent similarity; green indicates S288c Chr6 sequences; thick areas indicate regions conserved in JAY291; thin areas indicate nonconserved regions. The small segment in blue is a translocated fragment from S288c Chr10. Black indicates S. cerevisiae sequences not found in the S288c genome. The thick gray line corresponds to S. paradoxus Chr6 assembled from contigs 346, 345, 344, 434, and 433, from left to right, in this order (Kellis et al. 2003). SEC53 and RPN12 indicate the positions of the most distal essential genes in Chr6. The black circles indicate the position of the centromere (CEN6); the arrow denotes the YFLWTy2-1 element. Y′ and X subtelomeric sequences are not represented in this alignment. (B) Multistrain chromosome alignment around the left end of Chr6. The horizontal lines represent the left ends of the designated chromosomes, with the exception of S288c Chr1 (top line), for which the inverted right end is shown. The source strain for each sequence is indicated to the left in bold; other strains with similar chromosome structures are also indicated. Rectangles represent ORFs and their positions above and below the central line designate the Watson and Crick orientations, respectively. Chromosomal regions are color coded according to their correspondence to S288c (orange) Chr1, (green) Chr6, and (blue) Chr10. Regions in black correspond to sequences not found in the S288c genome. The dotted line in S288c Chr6 represents a discontinuity in the alignment at the site of a 19.3-kb insertion in JAY291. Rectangles hatched in red between chromosomes indicate a high level of sequence similarity (>85%; analogous to the red lines in A). All sequence similarities are indicated in red except for the left end of YJM789 Chr10, which contains the SNO3 and SNZ3 genes and is nearly identical to the collinear region in S288c Chr6. Boxed letters (A–F) indicate the specific chromosomal rearrangements discussed in the text, and SNO3, SNZ3, AGP3, and YAR064W indicate the positions of Southern blot probes used in Figure 4. The source sequences for this figure were the complete Chr6 sequences from S288c and JAY291, contigs 1.67 (Chr10) and 1.109 (Chr6) from RM11-1a, contigs 100 (Chr10) and 7 (Chr6) from YJM789, and contig 386 (Chr10) from JAY291. The 10-kb scale bar indicates the size scale for B.
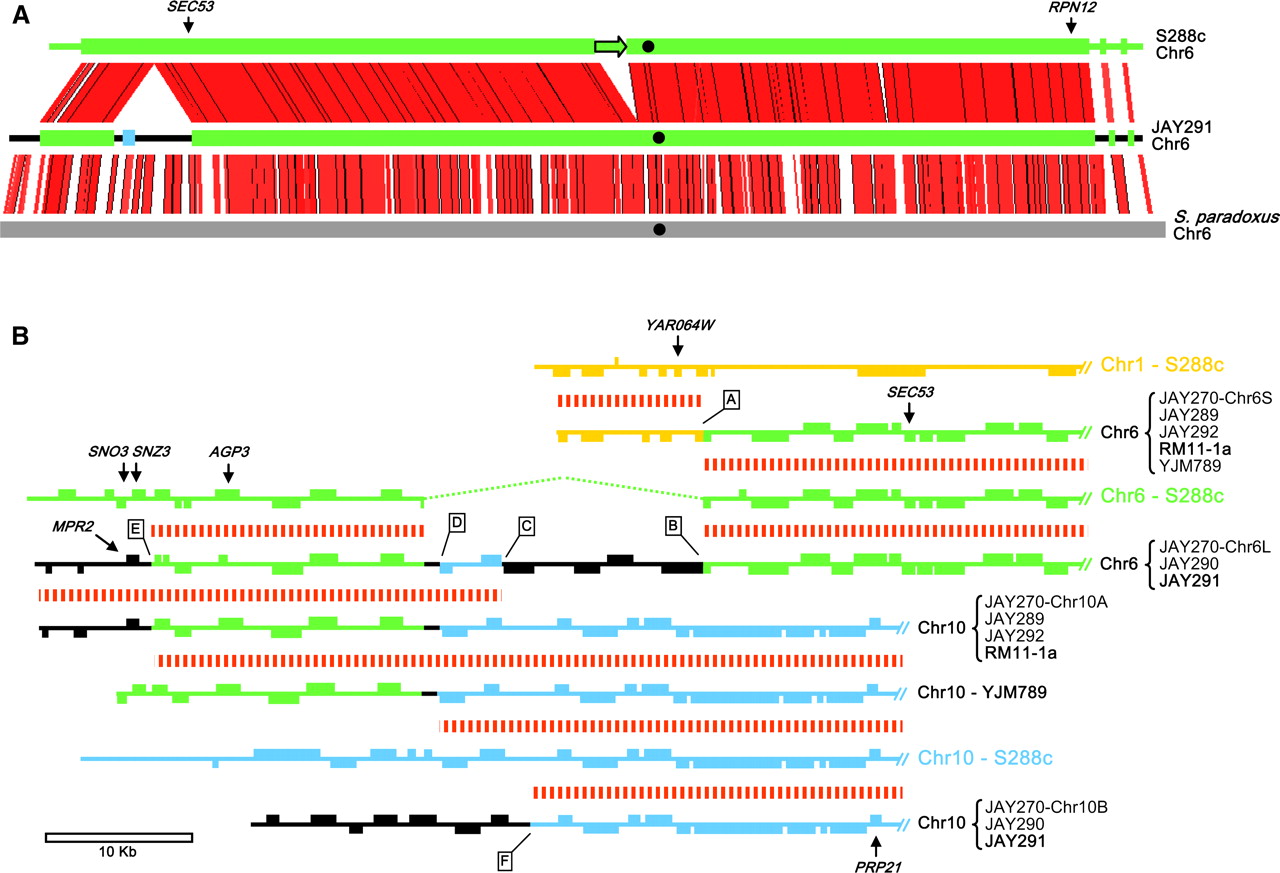
Although we concentrated our sequencing efforts on the JAY291 haploid, from our analysis of the sequences of S288c, RM11-1a, and YJM789, and from our examination of the microarray data and Southern analysis (Figs. 3–5), we were able to predict the structures at the left ends of the two Chr6 homologs in the JAY270 diploid. We then designed specific PCR primers to confirm our predictions (Supplemental Fig. 5). Repetitive DNA sequences were found at the breakpoints (shown as boxed letters in Fig. 6B) of all chromosomal rearrangements in this region, suggesting that they formed through ectopic homologous recombination.
We determined that JAY270 Chr6S has a portion of Chr1 that includes the YAR064W gene attached to the left end of Chr6 (Fig. 4C). This translocation is also present in RM11-1a and YJM789, and the breakpoint is between YAR062W in Chr1 (boxed “A”) and YFL051C in Chr6; both are pseudogene members of the FLO gene family. The YFL051C pseudogene is also the site of the 19.3-kb region that is present in JAY270 Chr6L and deleted in Chr6 from S288c. While YFL051C is short and nonfunctional in S288c, in JAY270 Chr6L, this open reading frame (ORF) extends into the 19.3-kb region to form a full-length FLO gene (boxed “B”). Near the left end of this insertion region, there was a 4.3-kb translocated section of S288c Chr10, with breakpoints at HXT8 (boxed “C”; a hexose transporter gene family member) and YJL216C (boxed “D”; a gene with similarity to maltase genes). Finally, the leftmost rearrangement in JAY270 Chr6L contains the 9.1-kb sequence not represented in S288c. The breakpoint for this rearrangement was at the THI5 gene (boxed “E”; a member of a gene family involved in the thiamine biosynthesis). In S288c, the SNO3 and SNZ3 genes are located immediately distal to THI5, whereas this region of Chr6L of JAY270 contains a copy of the MPR2 gene involved in tolerance to oxidative stress and ethanol toxicity (Du and Takagi 2007). MPR2 is also present the RM11-1a and Σ1278b strains, but strikingly, the genes in the MPR family are found at different genomic locations in these strains: in RM11-1a, MPR2 is at the left end of Chr10; whereas in Σ1278b, MPR2 is at the right end of Chr10, and MPR1 is at the left end of Chr14 (Takagi et al. 2000).
This detailed analysis also allowed us to examine the rearrangements between the two Chr10 homologs in JAY270 (arbitrarily designated A and B). The left end structure of Chr6L was essentially identical to that found in Chr10 of RM11-1a and in JAY270 Chr10A (inherited by the JAY289 and JAY292 spores). A similar Chr6/Chr10 translocation with a breakpoint at YJL216C (boxed “D”) has been described recently in the M22 vineyard strain (Doniger et al. 2008). The Chr10 structure in YJM789 is similar to RM11-1a, M22, JAY270 Chr10A, with the exception of the extreme left end at positions distal to THI5 (boxed “E”) where YJM789 is similar to S288c Chr6. Interestingly, the YJM789 Chr10 configuration is precisely what would be predicted from a crossover occurring between S288c Chr6 and RM11-1a Chr10 anywhere between THI5 and YFL051C. An analogous meiotic crossover event within translocated chromosomal segments has been recently observed in the S288c/Y101 laboratory hybrid (Faddah et al. 2009). The second JAY270 Chr10 homolog (Chr10B; inherited by JAY290 and JAY291) had at its left end an ∼15-kb translocated segment not found in the S288c genome. The breakpoint in this chromosome is near an unannotated Ty1 delta LTR element (boxed “F”) that is located on S288c Chr10 between SGD coordinates 29000 and 29500 and is also present in the JAY291 Chr10 sequence. Finally, it is important to note that all rearrangements described above occurred at sites distal to the first essential genes in the Chr6 (SEC53) and Chr10 (PRP21).
Nucleotide polymorphisms
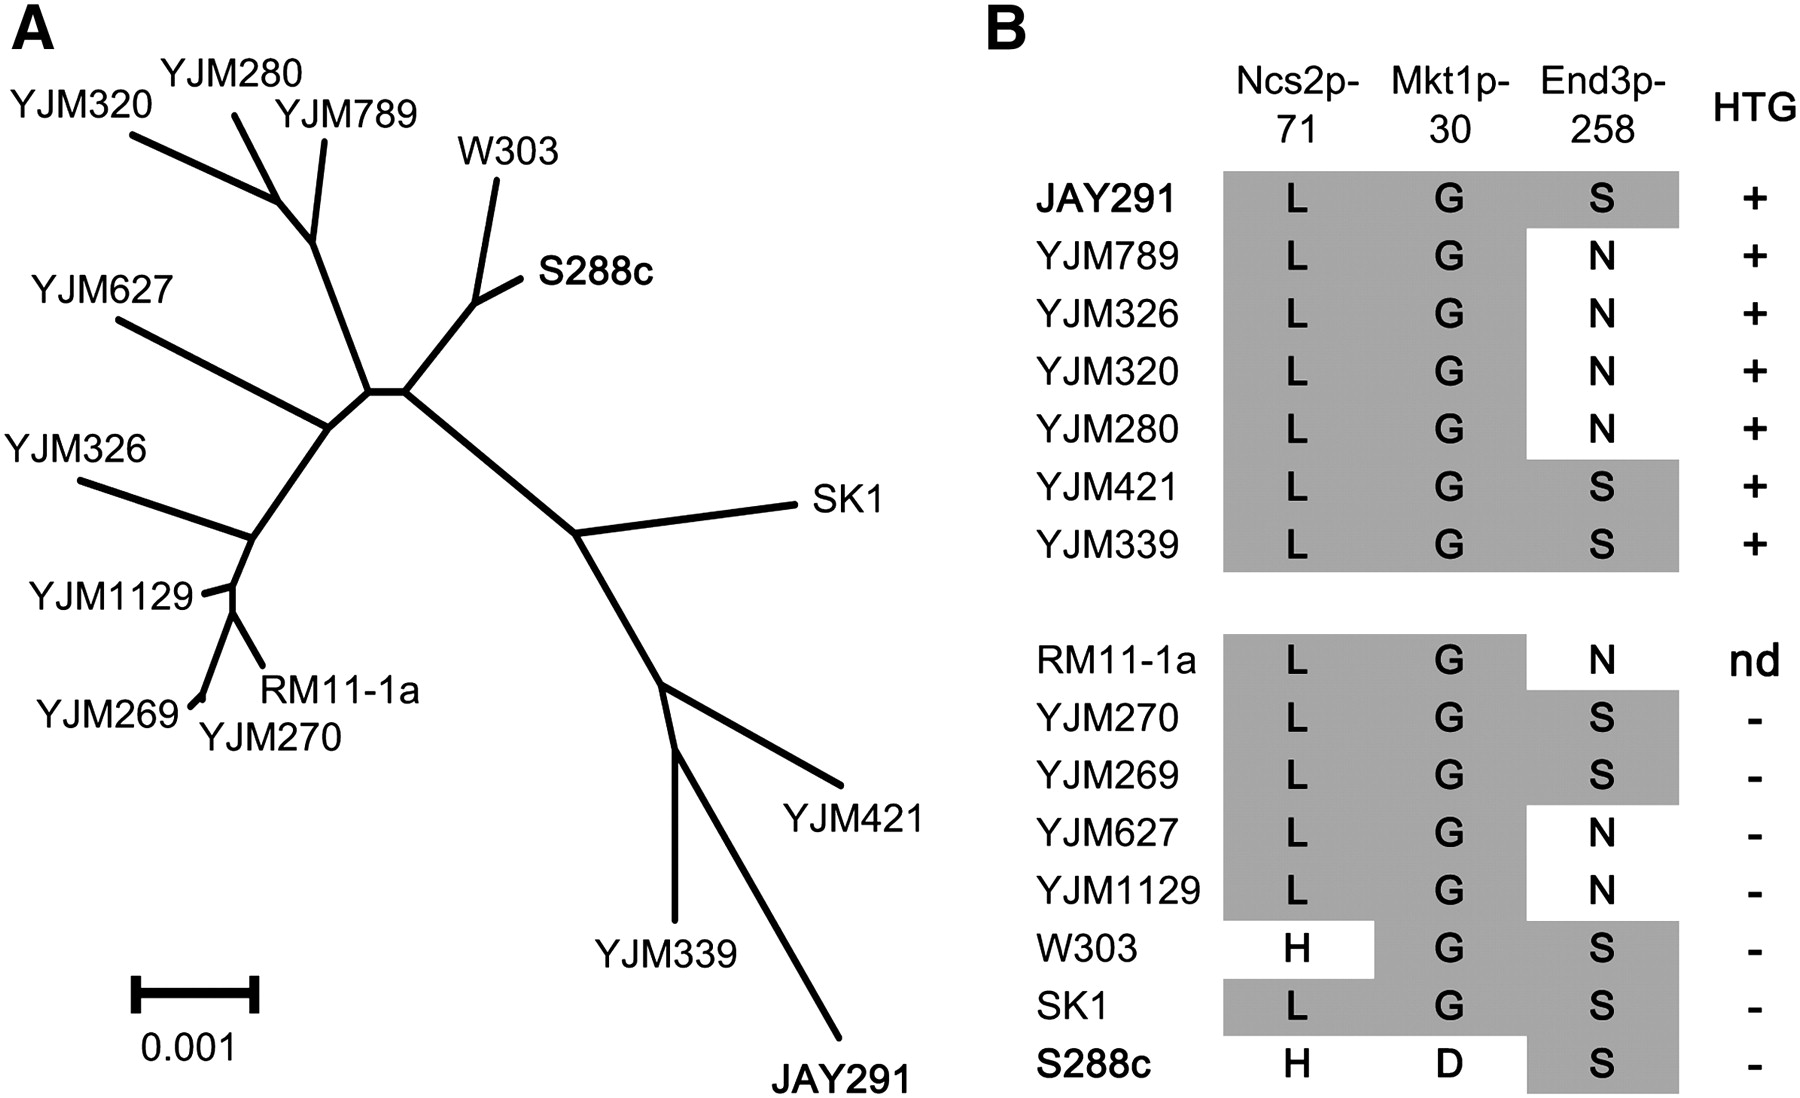
We compared the sequences of JAY291 to S288c, estimating the number of SNPs at 5.4 per kilobase (about 65,000 for the entire genome). To compare JAY291 to other S. cerevisiae strains, we analyzed an ∼49-kb region from Chr14 that has been sequenced for several unrelated strains (Steinmetz et al. 2002) and used it to construct an unrooted phylogenetic tree (Fig. 7A). This analysis indicated that JAY291 is highly diverged relative to S288c, YJM789, and RM11-1a and, therefore, will be useful in characterizing the rich sequence diversity present in S. cerevisiae.
Phylogenetic placement and HTG alleles in JAY291. (A) Unrooted phylogenetic tree of 15 S. cerevisiae strains based on a 49-kb region from Chr14 containing the three HTG QTLs (Sinha et al. 2008). (B) HTG QTL allele distribution in various S. cerevisiae strains. The three critical amino acid residues implicated in HTG are shaded in gray, and the HTG (+; −; nd, not determined) phenotype is shown to the right.
We also sought to estimate the degree of heterozygosity in the JAY270 diploid genome. We performed a limited sequence analysis of JAY292, a haploid spore derived from the same tetrad as JAY291. Because the genomic coverage in this case was relatively low (15-fold with Illumina paired-end reads), we did not attempt to assemble the genome de novo. Instead, we assembled the JAY292 sequence using the JAY291 contigs as reference. After filtering out repetitive elements, regions of high divergence, and regions of low quality and/or coverage, we estimated a density of ∼1.3 SNP/kb in the single-copy genomic regions. Because JAY291 and JAY292 are sibling haploid strains, about half of their genomes should be identical by descent, and we found that about half of the genomic regions had a very low level of polymorphisms (data not shown). We estimate, therefore, that the JAY270 diploid has ∼2.6 SNP/kb between allelic regions in homologous chromosomes.
We also examined heterozygosis restricting the analysis to the Chr6 sequences of JAY291 and JAY292. Because these two haploids carry the two reciprocal products of a meiotic crossover between the two parental Chr6 homologs (Fig. 4A), it should be possible to directly find all Chr6 SNPs in the diploid by comparing the JAY291 and JAY292 sibling sequences (assuming that they formed as a result of exactly one crossover). We found 465 SNPs in the 208-kb region common to both the Chr6L and Chr6S homologs (Fig. 5). The Chr6 SNP density (∼2.2 SNP/kb) was consistent with our estimate for the whole genome.
Overview of specific gene polymorphisms important for bioethanol production
We compared the sequences of several JAY291 genes to those of other strains to establish possible links between the genotype and the observed phenotypes. High-temperature growth (HTG) has been investigated in S. cerevisiae as a model for complex quantitative inheritance (Steinmetz et al. 2002; Sinha et al. 2008), and three major contributing loci have been identified: NCS2, MKT1, and END3. We found that JAY291 had all three of the alleles that are related to HTG+ (Fig. 7B). However, HTG, as is often the case for quantitative traits, is known to be influenced by genetic background (Sinha et al. 2006). We therefore tested the role of these polymorphisms in the JAY291 background by constructing isogenic strains carrying HTG− allele replacement versions of NCS2 and MKT1 from S288c, and END3 from YJM789. We found that the allele replacement strains, individually, were not compromised for HTG, at least within the resolution of our co-culture competition assays (about fivefold) (data not shown). This result was analogous to the background-specific phenotypic response described by Sinha et al. (2006) and suggested that other uncharacterized alleles present in the JAY291 genome are contributing to its distinct HTG+ phenotype.
We also examined the sequence of the HO gene that encodes the endonuclease that stimulates mating type switching in homothallic strains (Herskowitz 1988). The ho allele in JAY291 has three missense mutations, including the H475L substitution that is present in S288c, and has been shown to reduce HO activity significantly (Meiron et al. 1995; Ekino et al. 1999). In addition, an in-frame deletion between 8-bp direct repeats within the gene removed 36 amino acid residues from the DNA-binding domain (residues 524–559). These mutations likely eliminate the endonuclease activity of HO, explaining the heterothallic life cycle of JAY270.
Flocculation is a mechanism through which yeast cells aggregate to form clumps, or “flocs.” While flocculation is a desirable trait in brewing, it is problematic in sugar cane batch fermentation because it significantly slows fermentation kinetics and can cause excessive foaming and clogging of pipes. One of the attractive properties of JAY270 is that it rarely flocculates and produces very little foam in fermentation tanks (Basso et al. 2008). The JAY291 haploid is also non-flocculant. We examined the sequences of genes encoding cell surface adhesins involved in flocculation (FLO1, FLO5, FLO11, and others) and found that they are present in JAY291, although, due to their internal repeat structures (Verstrepen et al. 2004), these sequences were sometimes split between two contigs in our assembly. In addition, we looked at the FLO8 gene, a positive regulator of flocculation. In S288c, FLO8 contains a nonsense mutation (flo8-1) that renders the cells non-flocculant (Liu et al. 1996). The FLO8 gene in JAY291 appears to be functional, indicating that the non-flocculant phenotype of JAY291 involves a block in a different step of the pathway. Interestingly, among 120 F2 progeny from the S288c × JAY291 cross described above (Fig. 2), we observed 19 individuals that flocculated in fermentation media and 101 that did not; roughly a 1:7 phenotypic ratio expected for a trait controlled by three unlinked genes (χ2 = 1.22; P = 0.27). We genotyped the flocculant progeny by PCR and restriction digest and observed that all 19 flocculant progeny inherited the FLO8 allele from JAY291, therefore confirming the requirement of a functional Flo8p for flocculation.
In the S288c genome, there is a Ty1 retrotransposon insertion in the HAP1 gene (Gaisne et al. 1999). HAP1 encodes a heme-mediated transcription factor that controls the expression of genes involved in fermentation (Mense and Zhang 2006) and in the biosynthesis of ergosterol, which is important for ethanol tolerance (Inoue et al. 2000). As in other industrial strains (Tamura et al. 2004), this interrupting Ty1 element is absent in JAY291. Consistent with this result, we found that several of the Hap1p-regulated genes were expressed at a higher level in JAY270 than in S288c (Supplemental Table 1).
Another gene important for industrial yeast strains is MIP1, a nuclear-encoded mitochondrial DNA polymerase (Foury 1989). A polymorphism present in Mip1p (Mip1p-661A) has been shown recently to be responsible for the high frequency of spontaneous cytoplasmic respiratory mutations (ρ− petites) observed in S288c (Baruffini et al. 2007). The MIP1 sequence in JAY291 contains five nonsynonymous substitutions relative to S288c, including the Mip1p-661T variant, which is associated with a low frequency of petites. This desirable trait was confirmed in semiquantitative petite mutation assays in which JAY270 produced petite colonies at a frequency about fivefold lower than S288c (data not shown).
Efficient sucrose utilization is essential in sugar cane fermentation. S. cerevisiae strains have long been known to vary in the number of copies of the SUC genes coding for invertase, the enzyme that breaks down sucrose to glucose and fructose, which are then fermented to produce ethanol (Carlson and Botstein 1983). S288c only has one copy, SUC2, the only non-telomeric member of this gene family. Since JAY270 thrives in the sugar cane extract, we expected to find several SUC copies in its genome. Instead, the only invertase gene found in the genome sequence of JAY291 was SUC2. Another gene we did not find in JAY291 was RTM1 (Ness and Aigle 1995), involved in resistance to toxins found in molasses, a by-product of sugar production sometimes used in bioethanol fermentation. Incidentally, RTM1 is always found clustered with the telomeric copies of SUC genes (Ness and Aigle 1995).
A comprehensive list of all genes found in both JAY291 and S288c is presented in Supplemental Table 1, including the local density of SNPs inside the coding sequences and in the upstream regulatory regions, and the relative level of gene expression between these strains measured with cDNA microarrays. In addition to the shared genes discussed above, it is possible that the genes present in JAY291 but absent in S288c also contribute to the properties of JAY270. At least 16 such genes have been identified in the genome of JAY291 (Supplemental Table 1). An attractive example of such genes is the two copies of putative S-adenosylmethionine-dependent methyltransferases found in the JAY291 genome (contig404-gene1 and contig386-gene1; their predicted protein sequences share 92% similarity). These new genes participate in the same processes as the amplified SAM3 and SAM4 genes discussed above. Interestingly, a protein identical to the one coded by contig404-gene1 has been recently identified and found to be specific to the West African lineage of S. cerevisiae strains (hypothetical protein 5) (Liti et al. 2009).
Discussion
Diverse genome structure of JAY270 and its implications for genome evolution
Our molecular analysis of the JAY270 diploid revealed that its genome is highly heterogeneous, both structurally and at the nucleotide level. Thus far, the genomic analysis of S. cerevisiae had been mostly limited to haploids, often derived from homothallic diploid strains. In this type of life cycle, immediately after meiosis, the haploid spores undergo mating type switching, followed by self-mating to restore a diploid state (Herskowitz 1988). This cycle generates diploids that are homozygous for the entire genome, except at the MAT locus. In contrast, heterothallic spores, such as those derived from JAY270, are unable to switch mating type because of a mutation in the HO gene. The spores restore the diploid state by mating to spores of the opposite mating type, either siblings from the same ascus or by outcrossing (Knop 2006). The heterozygous JAY270 genome richly illustrates how this process is effective in preserving and amplifying genetic diversity. It is important to note, however, that both the homothallic and heterothallic life cycles require the production of viable haploid spores in meiosis, and thus both types of strains are expected to continuously remove from the gene pool recessive lethal mutations and chromosomal rearrangements associated with the loss of essential genes.
We have found that the genomes of JAY270 and S288c are collinear through most regions, and hybrids generated by crosses between these genetic backgrounds have good spore viability. Structural variation, although abundant, was limited to the end sections of chromosomes. A similar pattern has been previously observed in microarray-based surveys of genome variation among different S. cerevisiae strains (Winzeler et al. 2003; Carreto et al. 2008; Schacherer et al. 2009), which found that most polymorphisms, including SNPs and CNVs, were more common within 25 kb of the telomeres. In these studies, however, the full extent of the structural variation in these regions could not be revealed because the microarrays used were based on the S288c genome, and regions of high sequence divergence or sequences that were absent in the reference strain could not be examined. This gap has been recently filled by a whole-genome sequencing-based survey of dozens of S. cerevisiae and S. paradoxus strains (Liti et al. 2009). This study identified DNA sequences, including 38 genes, which are present in some of these strains but are absent in the reference S288c genome. Importantly, these new genes are mostly subtelomeric.
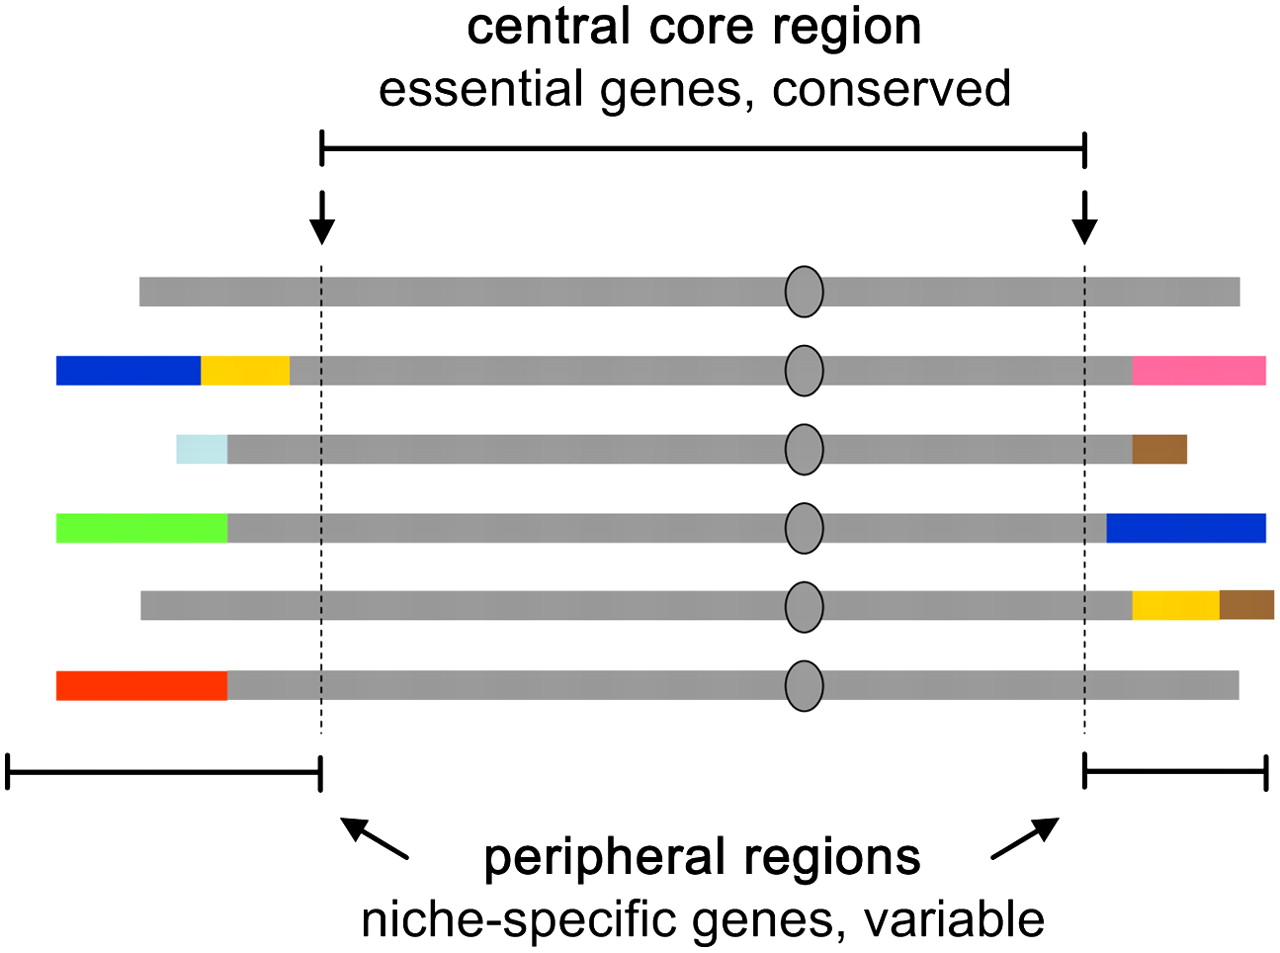
The peripheral regions of chromosomes in S. cerevisiae typically contain genes that participate in an alternative carbon source and vitamin metabolisms, ion and amino acid transport, flocculation, and other processes that are not essential for viability. In the S288c genome, ∼8% of all genes are located at sites distal to essential genes (Supplemental Table 1). Some of these genes, like SNO/SNZ and SAM, are functionally clustered. Previous studies have shown that there are very few functionally clustered genes in S. cerevisiae, and that those that are clustered tend to be associated with specific functions that differ between strains (Hall and Dietrich 2007). Analogous distributions of nonessential genes are also found in other species. For example, in Plasmodium falciparum, the peripheral regions encode variable surface antigen genes (contingency genes) that help this parasite evade the host's immune defenses (Freitas-Junior et al. 2000; Barry et al. 2003). Many of the genes found in such regions are members of multicopy gene families that allow structural variation to occur through ectopic homologous recombination events similar to those detected in JAY270. In addition to their repetitive nature, the telomere-proximal regions of chromosomes are often spatially colocalized at the nuclear envelope, forming clusters of chromatin that are believed to facilitate ectopic recombination interactions (Palladino et al. 1993; Gasser et al. 2004). Pryde et al. (1997) integrated these observations to formulate a model in which the yeast genome is structured in chromosomal sectors that are either rigid (central core) or plastic (peripheries). A schematic model of this concept as it relates to a set of S. cerevisiae haplotypes is shown in Figure 8.
Structural diversity in S. cerevisiae: rigid and plastic domains of the genome. The model depicts a set of homologs of a hypothetical chromosome in several unrelated S. cerevisiae strains. The top line (continuous gray) depicts the structural configuration of this chromosome in the first sequenced strain (i.e., S288c; reference), whereas the chromosomes shown below represent the rearrangements found in other strains. The diverged structural configurations (colors) in the peripheral regions harbor genes that are not required for viability, but that may contribute to fitness in specific environments. The entire set shares structural conservation in the central core region (delimited by the most distal essential genes, arrows); therefore, meiotic crossovers between the unrelated haplotypes can generate new combinations, while remaining compatible with haploid viability.
We recently demonstrated a mechanism in diploid strains that explains how repetitive elements participate in ectopic homologous recombination through their differential interactions with DNA double-strand breaks (DSBs) (Argueso et al. 2008). While lesions in single-copy regions of the genome are efficiently repaired to restore the original structures, DSBs that occur within repetitive sequences often lead to chromosomal rearrangements by engaging in homologous recombination with ectopic repeats. This experiment imposed no restrictions regarding the fitness effect or the haploid viability associated with the rearrangements; thus, we identified re-structuring events spanning the entire S. cerevisiae genome. Because most rearrangements were nonreciprocal and involved regions containing essential genes, it is likely that those events would be deleterious in meiosis, generating inviable spores and therefore eliminating them from the population. In contrast, the naturally occurring rearrangements observed in JAY270 are not detrimental, since the translocations do not span genes essential for viability. At least six chromosomes in JAY270 were polymorphic in length, and yet the diploid had excellent spore viability. Furthermore, crosses between spores derived from JAY270 and S288c generated hybrid diploids in which structural differences were present in virtually every homolog pair. Despite their heterogeneous karyotype, these hybrids produced mostly viable spores (75%–95%). We propose that all DSBs that occur in repetitive elements of the genome are able to promote ectopic recombination and generate chromosomal rearrangements. Those that span essential genes result in poor spore viability and are, therefore, eventually eliminated from the population, whereas those that involve the peripheral chromosome regions do not affect spore viability and may lead to increased fitness.
A distinguishing feature of the JAY270 genome architecture that may contribute to its fitness in competitive environments is the hemizygous distribution of useful stress-tolerance genes. It is possible that this configuration offers alternative mechanisms for diploid cells to adjust the copy number of these genes through mitotic crossover, break-induced replication, or meiotic segregation followed by re-mating of sibling haploid spores (Paques and Haber 1999; Knop 2006; Llorente et al. 2008). For example, these mechanisms could, in just a few generations, produce diploids containing 0 to 4 copies of MPR genes and 6 to 12 copies of SNO/SNZ genes. Notably, once the homozygous state is achieved, it may be reversed over time through outcrossing or ectopic homologous recombination between neighboring repeats. This scenario may explain how the highly plastic genome structure at the peripheral regions of chromosomes could enable S. cerevisiae to rapidly respond to a changing environment.
Finally, it is interesting to contrast the pattern of spatially restricted chromosomal rearrangements in S. cerevisiae to the much more radical chromosomal rearrangements recently described in the haploid asexual yeast pathogen Candida glabrata (Polakova et al. 2009). These very complex genome reconfiguration events included chromosome fusions, large translocations, aneuploidy, and even possible circularization that are completely incompatible with meiosis. These authors proposed that C. glabrata has taken genome re-structuring to the extreme, sacrificing its sexual life cycle to fully explore the adaptation potential provided by a highly unstable genome structure. We believe that S. cerevisiae has found the middle ground by confining the genome rearrangements to the ends of chromosomes.
Implications of highly adapted industrial strains to future bioenergy technologies
In addition to the insights into genome evolution discussed above, the analysis of the JAY270 genome offers several opportunities for the development of a new generation of industrial yeast strains. The finding that JAY270 is genetically compatible with laboratory strains indicates that the full arsenal of research tools developed to study yeast as a model system can be readily applied to the modification of this naturally adapted strain. We envision the use of JAY270 as an ideal delivery vehicle for future renewable energy technologies. One of the most active fields of investigation in the effort to develop these technologies has been the search for strategies to efficiently break down cellulosic feedstocks and to use its complex derived sugars in bioethanol fermentation (Gura 2009). These advances would dramatically improve the overall energy balance in bioethanol production. While the early signs of success in this effort are very encouraging, it is important to remember that even when the solutions for this problem are found, there will be a need to efficiently deliver these technologies to the industrial setting. Decades of experience in the development of industrial strains have convincingly demonstrated that any large-scale attempt to introduce genetically modified yeast strains in the bioethanol industry will be futile unless they are based on naturally adapted strains. Therefore, strains such as JAY270 are likely to play a key role in facilitating the transition from laboratory technological breakthroughs to industrial-scale field applications.
Methods
Growth media and yeast strains
Yeast culture, mating, sporulation, and tetrad dissection were conducted using standard procedures (Rose et al. 1990). Menadione was obtained from Sigma-Aldrich. The PE-2 stock used to purify JAY270 was from our own laboratory collection, which was derived from commercially available dry active yeast sold to bioethanol distilleries (LNF-Latino Americana). The S288c-isogenic strain used as a control in the fermentation assays in Figure 1A was the BY4741 haploid (Giaever et al. 2002). For the initial genetic characterization of JAY270, the S288c-isogenic strains used were from the FY series (Winston et al. 1995). FY833 (MATa, ura3-52, leu2Δ1, trp1Δ63, his3Δ200, lys2Δ202) and FY834 (MATα, ura3-52, leu2Δ1, trp1Δ 63, his3Δ200, lys2Δ202) were crossed to the JAY270-derived haploid spores JAY289 (MATa), JAY290 (MATα), JAY291 (MATa), and JAY292 (MATα) to generate hybrid diploids. FY23 (MATa, ura3-52, leu2Δ1, trp1Δ63) and FY86 (MATα, ura3-52, leu2Δ1, his3Δ200) were crossed to each other to generate the JAY309 diploid used as a control in comparative stress tolerance assays (Fig. 1B; Supplemental Figs. 2 and 3). Finally, the S288c-isogenic strains used in the quantitative genetic analysis described in Figure 2 were S1 and S97 (Steinmetz et al. 2002). Genomic DNA was also prepared from RM11-1a and YJM789 strains.
Fermentation assays
The fermentation assays shown in Figure 1A were carried out by inoculating 4 g of fresh yeast cells in 36 mL of autoclaved sugar cane extract (pH 4.0, 18.2% Total Reducing Sugars—mostly sucrose). Fermentation cultures were incubated without agitation for exactly 15 h at 30°C. The cells were recovered by centrifugation and the supernatant was distilled for the measurement of ethanol by densimetry. Cells were recycled for five consecutive fermentation cycles, and four independent replicates were analyzed for each genotype. In each replicate, only the data from cycles 2 to 5 were considered, since the data from the first cycle (adaptation round) are usually highly variable. The final ethanol concentration measurements from cycles 2 to 5 from all four replicates were combined to generate the average and standard error shown.
The fermentation assays used in the quantitative genetic analysis (Fig. 2) were carried out by inoculating 0.08 g of fresh yeast cells in 8 mL of media containing 0.5% yeast extract, 1% peptone, and 10% glucose. Cells were pre-grown in the same media for two cycles to provide an adaptation round. The cell mass concentration was normalized to 1% prior to the third cycle, which was used to record cell growth and ethanol production kinetics. Cultures were incubated at 30°C in a slow rotating drum to avoid decantation. Samples were taken at regular intervals and centrifuged in pre-weighted tubes to determine the weight of the cell pellets. The supernatant was frozen and later used to determine the ethanol concentration using the BioChain Saccharide Removal and Ethanol Assay kits in sequence according to the manufacturer's recommendations.
Microarray and physical analysis of DNA
CGH-array and band-array experiments and PFGE procedures were conducted as previously described (Argueso et al. 2008). Image tracing of PFGE bands was obtained using Bio-Rad Quantity One software. All PCR reactions were conducted using Bio-Rad iProof High-Fidelity DNA polymerase. For the differential gene expression experiments shown in Supplemental Table 1, total RNA was extracted from exponentially growing cells of JAY309 and JAY270. Three independent biological replicates were grown in YP 2% glucose liquid media, with 30°C incubation and 200-rpm agitation. First-strand cDNA was synthesized and labeled with dUTP-Cy3 or dUTP-Cy5, respectively, using the Invitrogen SuperScript Direct labeling kit. Labeled cDNAs were then competitively hybridized to microarrays containing all S288c ORFs. The log2 (Cy5/Cy3) signals for all three replicates and average for each microarray probe are shown. The CGH/band-array and the differential gene expression microarray data are available under GEO accession numbers GSE14601 and GSE17578, respectively.
Parallel sequencing and genome assembly
Total genomic DNA from JAY291 was isolated using the QIAGEN Maxi kit. We performed sequencing in the Illumina Genome Analyzer II and 454 Life Sciences Genome Sequencer FLX (Roche) platforms (Table 1), using standard manufacturer's recommended sample preparation procedures. The Illumina and 454 reads were assembled into longer contigs using de novo assembler Edena (Hernandez et al. 2008) and Newbler (Roche), respectively. The hybrid assembly was performed through the combination of 3581 Illumina contigs and 1259 454 contigs resulting in 452 hybrid contigs (pipeline, “Zorro,” developed in our group) (GGL Costa, RO Vidal, MF Carazzolle, JMC Mondego, MJ Guiltinam, SC Schuster, JE Carlson, PA Mieczkowski, JL Argueso, LW Meinhardt, et al., in prep.). Briefly, the Zorro pipeline consists of (1) masking repeat regions in the contigs, (2) overlap detection, (3) unmasking repeat regions, and (4) assembly of hybrid contigs. In phase 1, the repeat regions were determined based on counting occurrences of k-mers in the Roche 454 reads; the assembler then masks k-mers in the contigs that occur at high frequency. The absence of repeats produces correct overlap detection in phase 2. The contigs are then unmasked in phase 3, and the correct hybrid assembly can be obtained in phase 4 by merging all overlapping contigs into hybrid contigs. The overlaps detection and consensus generation were performed using the Minimus package (Sommer et al. 2007). The hybrid contigs were ordered and oriented with the Bambus program (Pop et al. 2004) using paired-end information and manual verification producing 427 scaffolds. These sequences were aligned to the reference genome (S288c) using the MUMmer package (Kurtz et al. 2004). The genome comparisons were visualized using the Artemis Comparison Tool (ACT) (Carver et al. 2005). Ab initio and extrinsic gene predictions were obtained using AUGUSTUS (Stanke and Morgenstern 2005) and exonerate (Slater and Birney 2005), respectively. For the AUGUSTUS analysis, we used the training sets available for S288c, and for exonerate, we used the reference curated ORFs (SGD; http://www.yeastgenome.org) that were aligned into our hybrid assembly.
Acknowledgments
We are grateful to Chris Vinci, Steven Clarke, Dina Raveh, Joseph Heitman, and Eric Alani for useful discussions and comments on the manuscript. We thank CENAPAD-SP (Centro Nacional de Processamento de Alto Desempenho de São Paulo) for data processing support. Research in the Pereira, Tavares, Alcarde, and Andrietta laboratories is supported by CNPq (Conselho Nacional de Desenvolvimento Científico e Tecnológico), FAPESP (Fundação de Amparo à Pesquisa do Estado de São Paulo), and CAPES (Coordenadoria de Aperfeiçoamento de Pessoal de Nível Superior). Research in the Pereira laboratory was also supported by a BRASKEM/FAPESP grant (PITE3–07/58336-3) and ETH Bioenergia. Work in the Petes laboratory was funded by NIH grants GM52319 and GM24110.
References
- ↵JL ArguesoJ WestmorelandPA MieczkowskiM GawelTD PetesMA Resnick(2008) Double-strand breaks associated with repetitive DNA can reshape the genome. Proc Natl Acad Sci 105:11845–11850.
- ↵JD BarryML GingerP BurtonR McCulloch(2003) Why are parasite contingency genes often associated with telomeres? Int J Parasitol 33:29–45.
- ↵E BaruffiniT LodiC DallabonaF Foury(2007) A single nucleotide polymorphism in the DNA polymerase gamma gene of Saccharomyces cerevisiae laboratory strains is responsible for increased mitochondrial DNA mutability. Genetics 177:1227–1231.
- ↵LC BassoHV de AmorimAJ de OliveiraML Lopes(2008) Yeast selection for fuel ethanol production in Brazil. FEMS Yeast Res. 8:1155–1163.
- ↵AR BornemanAH ForganIS PretoriusPJ Chambers(2008) Comparative genome analysis of a Saccharomyces cerevisiae wine strain. FEMS Yeast Res. 8:1185–1195.
- ↵M CarlsonD Botstein(1983) Organization of the SUC gene family in Saccharomyces. Mol Cell Biol 3:351–359.
- ↵L CarretoMF EirizAC GomesPM PereiraD SchullerMA Santos(2008) Comparative genomics of wild type yeast strains unveils important genome diversity. BMC Genomics 9:524, 10.1186/1471-2164-9-524.
- ↵TJ CarverKM RutherfordM BerrimanMA RajandreamBG BarrellJ Parkhill(2005) ACT: The Artemis Comparison Tool. Bioinformatics 21:3422–3423.
- ↵EA da SilvaSKB dos SantosAD ResendeJOF de MoraisMA de MoraisDA Simoes(2005) Yeast population dynamics of industrial fuel-ethanol fermentation process assessed by PCR-fingerprinting. Antonie Van Leeuwenhoek 88:13–23.
- ↵SW DonigerHS KimD SwainD CorcueraM WilliamsSP YangJC Fay(2008) A catalog of neutral and deleterious polymorphism in yeast. PLoS Genet 4:e1000183, 10.1371/journal.pgen.1000183.
- ↵X DuH Takagi(2007) N-Acetyltransferase Mpr1 confers ethanol tolerance on Saccharomyces cerevisiae by reducing reactive oxygen species. Appl Microbiol Biotechnol 75:1343–1351.
- ↵M EhrenshaftP BilskiMY LiCF ChignellME Daub(1999) A highly conserved sequence is a novel gene involved in de novo vitamin B6 biosynthesis. Proc Natl Acad Sci 96:9374–9378.
- ↵K EkinoI KwonM GotoS YoshinoK Furukawa(1999) Functional analysis of HO gene in delayed homothallism in Saccharomyces cerevisiae wy2. Yeast 15:451–458.
- ↵DA FaddahEW GankoC McCoachJK PickrellSE HanlonFG MannJO MieczkowskaCD JonesJD LiebTJ Vision(2009) Systematic identification of balanced transposition polymorphisms in Saccharomyces cerevisiae. PLoS Genet 5:e1000502, 10.1371/journal.pgen.1000502.
- ↵G FischerSA JamesIN RobertsSG OliverEJ Louis(2000) Chromosomal evolution in Saccharomyces. Nature 405:451–454.
- ↵F Foury(1989) Cloning and sequencing of the nuclear gene MIP1 encoding the catalytic subunit of the yeast mitochondrial DNA polymerase. J Biol Chem 264:20552–20560.
- ↵TD FoxLS FolleyJJ MuleroTW McmullinPE ThorsnessLO HedinMC Costanzo(1991) Analysis and manipulation of yeast mitochondrial genes. Methods Enzymol 194:149–165.
- ↵LH Freitas-JuniorE BottiusLA PirritKW DeitschC ScheidigF GuinetU NehrbassTE WellemsA Scherf(2000) Frequent ectopic recombination of virulence factor genes in telomeric chromosome clusters of P. falciparum. Nature 407:1018–1022.
- ↵M GaisneAM BecamJ VerdiereCJ Herbert(1999) A “natural” mutation in Saccharomyces cerevisiae strains derived from S288c affects the complex regulatory gene HAP1 (CYP1) Curr Genet 36:195–200.
- ↵SM GasserF HedigerA TaddeiFR NeumannMR Gartenberg(2004) The function of telomere clustering in yeast: The Circe effect. Cold Spring Harb Symp Quant Biol 69:327–337.
- ↵G GiaeverAM ChuL NiC ConnellyL RilesS VeronneauS DowA Lucau-DanilaK AndersonB Andre(2002) Functional profiling of the Saccharomyces cerevisiae genome. Nature 418:387–391.
- ↵A Goffeau(2004) Evolutionary genomics: Seeing double. Nature 430:25–26.
- ↵A GoffeauBG BarrellH BusseyRW DavisB DujonH FeldmannF GalibertJD HoheiselC JacqM Johnston(1996) Life with 6000 genes. Science 274:546, 563–546, 567.
- ↵J Goldemberg(2007) Ethanol for a sustainable energy future. Science 315:808–810.
- ↵JL GordonKP ByrneKH Wolfe(2009) Additions, losses, and rearrangements on the evolutionary route from a reconstructed ancestor to the modern Saccharomyces cerevisiae genome. PLoS Genet 5:e1000485, 10.1371/journal.pgen.1000485.
- ↵T Gura(2009) Driving biofuels from field to fuel tank. Cell 138:9–12.
- ↵C HallFS Dietrich(2007) The reacquisition of biotin prototrophy in Saccharomyces cerevisiae involved horizontal gene transfer, gene duplication and gene clustering. Genetics 177:2293–2307.
- ↵D HernandezP FrancoisL FarinelliM OsterasJ Schrenzel(2008) De novo bacterial genome sequencing: Millions of very short reads assembled on a desktop computer. Genome Res 18:802–809.
- ↵I Herskowitz(1988) Life cycle of the budding yeast Saccharomyces cerevisiae. Microbiol Rev 52:536–553.
- ↵T InoueH IefujiT FujiiH SogaK Satoh(2000) Cloning and characterization of a gene complementing the mutation of an ethanol-sensitive mutant of sake yeast. Biosci Biotechnol Biochem 64:229–236.
- ↵M KellisN PattersonM EndrizziB BirrenES Lander(2003) Sequencing and comparison of yeast species to identify genes and regulatory elements. Nature 423:241–254.
- ↵M Knop(2006) Evolution of the hemiascomycete yeasts: On life styles and the importance of inbreeding. Bioessays 28:696–708.
- ↵S KurtzA PhillippyAL DelcherM SmootM ShumwayC AntonescuSL Salzberg(2004) Versatile and open software for comparing large genomes. Genome Biol 5:R12, 10.1186/gb-2004-5-2-r12.
- ↵S LandolfoH PolitiD AngeozziI Mannazzu(2008) ROS accumulation and oxidative damage to cell structures in Saccharomyces cerevisiae wine strains during fermentation of high-sugar-containing medium. Biochim Biophys Acta 1780:892–898.
- ↵G LitiDM CarterAM MosesJ WarringerL PartsSA JamesRP DaveyIN RobertsA BurtV Koufopanou(2009) Population genomics of domestic and wild yeasts. Nature 458:337–341.
- ↵HP LiuCA StylesGR Fink(1996) Saccharomyces cerevisiae S288C has a mutation in FL08 a gene required for filamentous growth. Genetics 144:967–978.
- ↵B LlorenteCE SmithLS Symington(2008) Break-induced replication: What is it and what is it for? Cell Cycle 7:859–864.
- ↵H MeironE NahonD Raveh(1995) Identification of the heterothallic mutation in HO-endonuclease of S. cerevisiae using HO/ho chimeric genes. Curr Genet 28:367–373.
- ↵SM MenseL Zhang(2006) Heme: A versatile signaling molecule controlling the activities of diverse regulators ranging from transcription factors to MAP kinases. Cell Res 16:681–692.
- ↵F NessM Aigle(1995) RTM1: A member of a new family of telomeric repeated genes in yeast. Genetics 140:945–956.
- ↵PA PadillaEK FugeME CrawfordA ErrettM Werner-Washburne(1998) The highly conserved, coregulated SNO and SNZ gene families in Saccharomyces cerevisiae respond to nutrient limitation. J Bacteriol 180:5718–5726.
- ↵F PalladinoT LarocheE GilsonA AxelrodL PillusSM Gasser(1993) SIR3 and SIR4 proteins are required for the positioning and integrity of yeast telomeres. Cell 75:543–555.
- ↵F PaquesJE Haber(1999) Multiple pathways of recombination induced by double-strand breaks in Saccharomyces cerevisiae. Microbiol Mol Biol Rev 63:349–404.
- ↵S PolakovaC BlumeJA ZarateM MentelD Jorck-RambergJ StenderupJ Piskur(2009) Formation of new chromosomes as a virulence mechanism in yeast Candida glabrata. Proc Natl Acad Sci 106:2688–2693.
- ↵M PopDS KosackSL Salzberg(2004) Hierarchical scaffolding with Bambus. Genome Res 14:149–159.
- ↵FE PrydeHC GorhamEJ Louis(1997) Chromosome ends: All the same under their caps. Curr Opin Genet Dev 7:822–828.
- ↵GP RobertsonVH DaleOC DoeringSP HamburgJM MelilloMM WanderWJ PartonPR AdlerJN BarneyRM Cruse(2008) Agriculture. Sustainable biofuels redux. Science 322:49–50.
- ↵S Rodriguez-NavarroB LlorenteMT Rodriguez-ManzanequeA RamneG UberD MarchesanB DujonE HerreroP SunnerhagenJ Perez-Ortin(2002) Functional analysis of yeast gene families involved in metabolism of vitamins B-1 and B-6. Yeast 19:1261–1276.
- ↵MD RoseF WinstonP Hieter(1990) Methods in yeast genetics (Cold Spring Harbor Laboratory Press, Cold Spring Harbor, NY).
- ↵K Sanderson(2006) US biofuels: A field in ferment. Nature 444:673–676.
- ↵DR ScannellG ButlerKH Wolfe(2007) Yeast genome evolution—the origin of the species. Yeast 24:929–942.
- ↵J SchachererJA ShapiroDM RuderferL Kruglyak(2009) Comprehensive polymorphism survey elucidates population structure of Saccharomyces cerevisiae. Nature 458:342–345.
- ↵H SinhaBP NicholsonLM SteinmetzJH McCusker(2006) Complex genetic interactions in a quantitative trait locus. PLoS Genet 2:e13, 10.1371/journal.pgen.0020013.
- ↵H SinhaL DavidRC PasconS Clauder-MunsterS KrishnakumarM NguyenG ShiJ DeanRW DavisPJ Oefner(2008) Sequential elimination of major-effect contributors identifies additional quantitative trait loci conditioning high-temperature growth in yeast. Genetics 180:1661–1670.
- ↵GS SlaterE Birney(2005) Automated generation of heuristics for biological sequence comparison. BMC Bioinformatics 6:31, 10.1186/1471-2105-6-31.
- ↵DD SommerAL DelcherSL SalzbergM Pop(2007) Minimus: A fast, lightweight genome assembler. BMC Bioinformatics 8:64, 10.1186/1471-2105-8-64.
- ↵M StankeB Morgenstern(2005) AUGUSTUS: A web server for gene prediction in eukaryotes that allows user-defined constraints. Nucleic Acids Res 33:W465–W467.
- ↵LM SteinmetzH SinhaDR RichardsJI SpiegelmanPJ OefnerJH McCuskerRW Davis(2002) Dissecting the architecture of a quantitative trait locus in yeast. Nature 416:326–330.
- ↵H TakagiM ShichiriM TakemuraM MohriS Nakamori(2000) Saccharomyces cerevisiae sigma 1278b has novel genes of the N-acetyltransferase gene superfamily required for L-proline analogue resistance. J Bacteriol 182:4249–4256.
- ↵K TamuraY GuQ WangT YamadaK ItoH Shimoi(2004) A hap1 mutation in a laboratory strain of Saccharomyces cerevisiae results in decreased expression of ergosterol-related genes and cellular ergosterol content compared to sake yeast. J Biosci Bioeng 98:159–166.
- ↵FCA TavaresS Echeverrigaray(1987) in Biochemistry and biology of industrial yeasts, Yeast breeding for fuel production, ed G Stewart(CRC, Boca Raton, Florida), pp 59–80.
- ↵KJ VerstrepenTB ReynoldsGR Fink(2004) Origins of variation in the fungal cell surface. Nat Rev Microbiol 2:533–540.
- ↵CR VinciSG Clarke(2007) Recognition of age-damaged (R,S)-adenosyl-L-methionine by two methyltransferases in the yeast Saccharomyces cerevisiae. J Biol Chem 282:8604–8612.
- ↵P WangY KimJ PollackB NarasimhanR Tibshirani(2005) A method for calling gains and losses in array CGH data. Biostatistics 6:45–58.
- ↵W WeiJH McCuskerRW HymanT JonesY NingZ CaoZ GuD BrunoM MirandaM Nguyen(2007) Genome sequencing and comparative analysis of Saccharomyces cerevisiae strain YJM789. Proc Natl Acad Sci 104:12825–12830.
- ↵AE WhealsLC BassoDM AlvesHV Amorim(1999) Fuel ethanol after 25 years. Trends Biotechnol 17:482–487.
- ↵F WinstonC DollardSL Ricuperohovasse(1995) Construction of a set of convenient Saccharomyces cerevisiae strains that are isogenic to S288C. Yeast 11:53–55.
- ↵EA WinzelerCI Castillo-DavisG OshiroD LiangDR RichardsY ZhouDL Hartl(2003) Genetic diversity in yeast assessed with whole-genome oligonucleotide arrays. Genetics 163:79–89.
Notes
[4] [Supplemental material is available online at http://www.genome.org. This whole-genome shotgun project has been deposited at DDBJ/EMBL/GenBank under accession no. ACFL00000000. The version described in this work is the first version, ACFL01000000. The microarray data from this study have been deposited at the NCBI Gene Expression Omnibus (http://www.ncbi.nlm.nih.gov/geo/) under accession nos. GSE14601 and GSE17578.]
[5] Article published online before print. Article and publication date are at http://www.genome.org/cgi/doi/10.1101/gr.091777.109.