
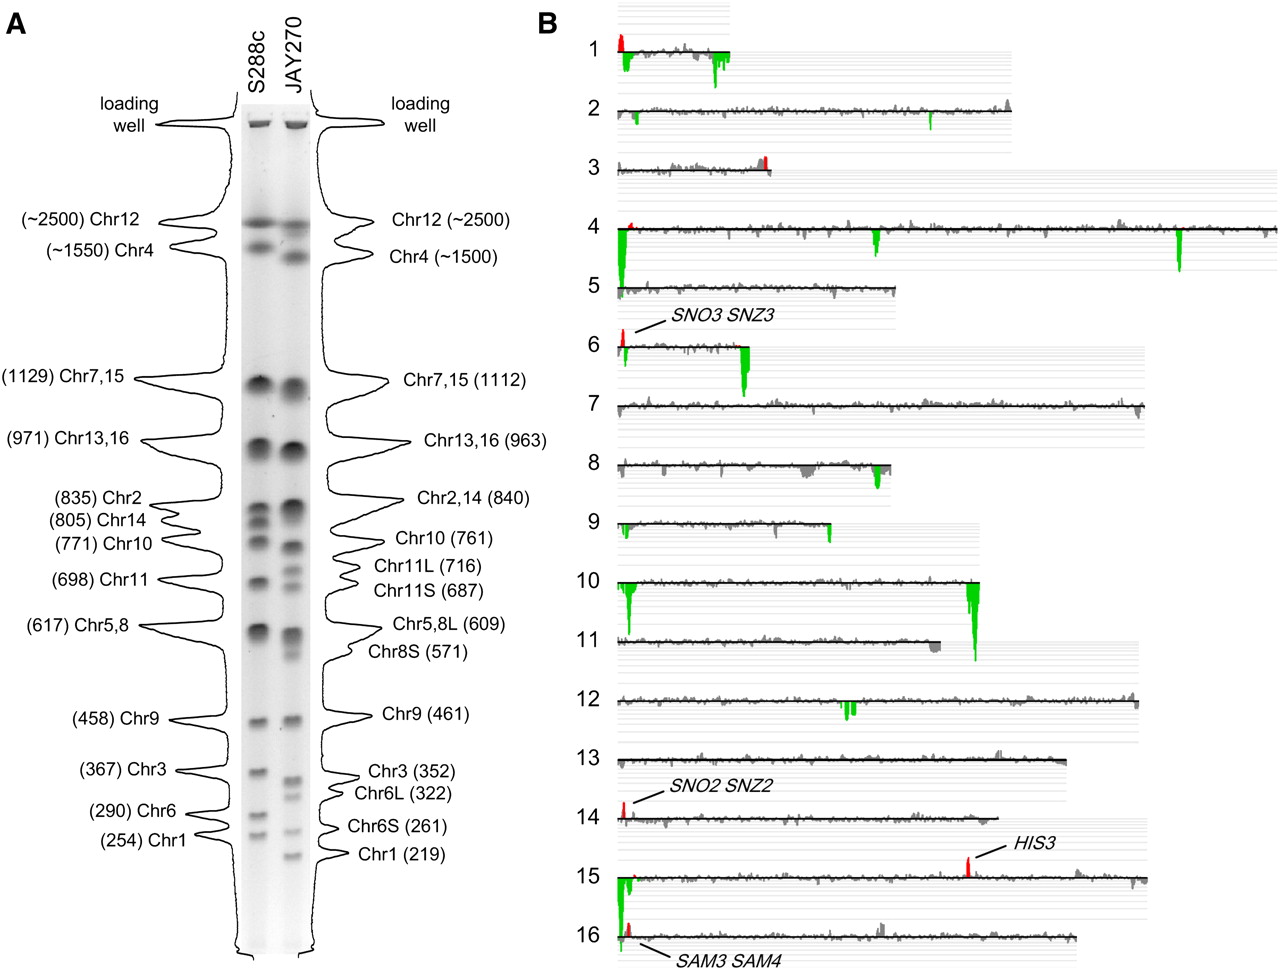
Molecular karyotype and gene CNV in JAY270. (A) PFGE and densitometric analysis of individual chromosomal bands in S288c and JAY270. The size of the peaks reflects the intensity of the ethidium bromide staining for each chromosomal band as determined by image analysis using Bio-Rad QuantityOne software. The predicted chromosome sizes (in kilobases) shown next to the corresponding chromosomal peaks were determined by comparison to the Bio-Rad l molecular weight ladder (data not shown). Note the presence of different-sized homologs for Chr6 and Chr11 that appear at lower relative intensities. Contrast the abundance of each Chr6 homolog to the intensity of Chr3 for which both homologs are about the same size, and compare the abundance of each Chr11 homolog to the intensity of Chr10. (B) CGH-array relative gene dosage plots. Each horizontal line corresponds to a specific S288c chromosome; the signal of each array probe was smoothed in CGH-miner software in a seven-probe sliding window to reduce noise (Wang et al. 2005). (Gray areas) Regions of similar genomic dosage; (positive/red peaks) genomic regions overrepresented; (negative/green peaks) genomic regions underrepresented. The amplification signal on the left end of Chr1 included the SEO1 gene encoding a putative amino acid permease; the amplification peak on the right end of Chr3 did not include any known genes; all other amplifications are discussed in the text. None of the deletion/underrepresentation peaks spanned regions containing genes known to be essential in S288c. The S288c-isogenic control strain used in A and B was the JAY309 diploid.


