
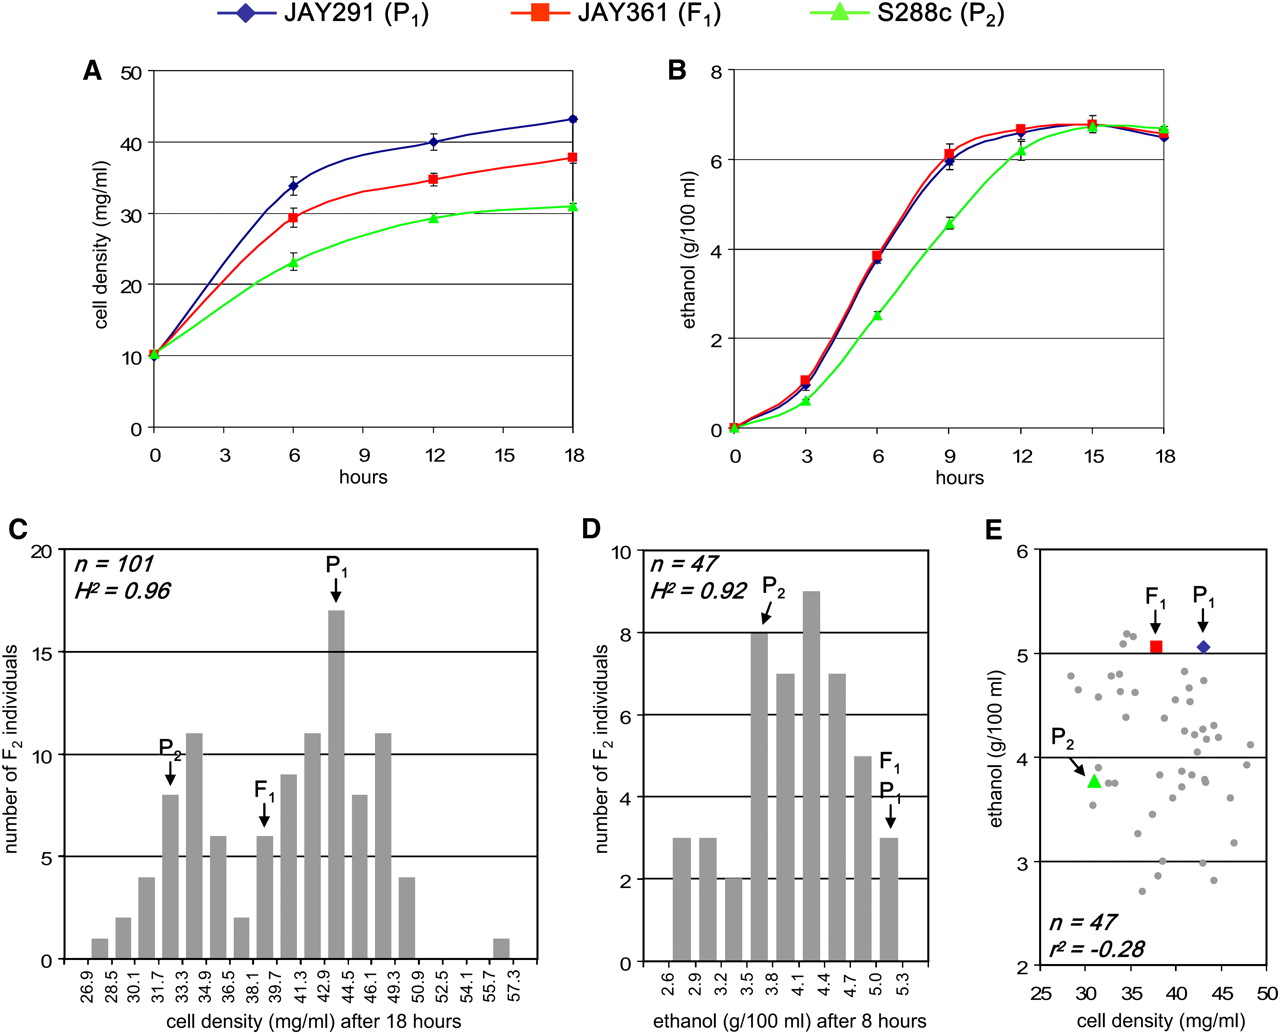
Genetic analysis of cell mass accumulation and ethanol production kinetics. (A) Kinetics of cell mass accumulation and (B) ethanol production during fermentation of rich media with 10% glucose. The results show the average values and standard error for three biological replicates from each strain. The S288c-isogenic strains used in these assays were the MATα haploids S1 (ρ+) and S97 (ρ0). The JAY361 diploid was obtained by mating JAY291 and S97; this diploid inherited 100% of its mitochondrial genome from JAY291. (C) The distributions of cell mass accumulation after 18 h and (D) ethanol production after 8 h among haploid F2 spores derived from JAY361. F2 individuals were grouped in bins according to their phenotypes, and the bars represent the number of individuals in each phenotypic bin. (E) Scatterplot of cell density (x-axis) versus ethanol concentration (y-axis) for all F2 individuals tested in both assays (gray dots). The relative phenotypes of (P1) JAY291, (F1) JAY361, and (P2) S1. n is the number of F2 individuals in each data set, H2 is the broad-sense heritability calculated from phenotypic and environmental variances, and r2 is the coefficient of correlation between the two traits analyzed. Only data from non-flocculant F2 individuals were used in this analysis.


