
-
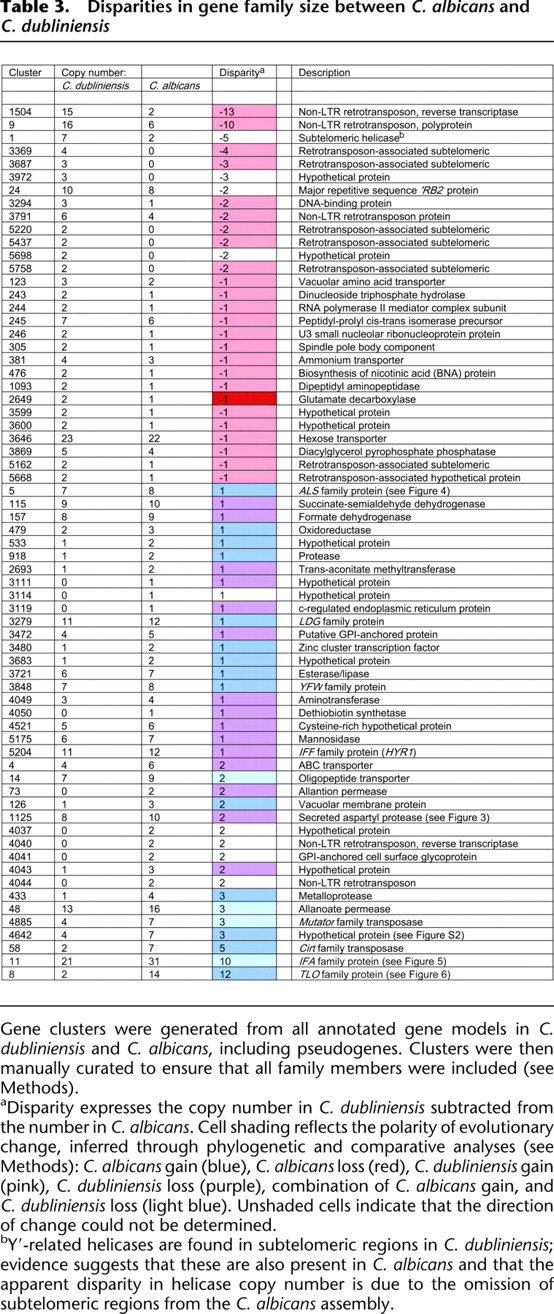
Gene clusters were generated from all annotated gene models in C. dubliniensis and C. albicans, including pseudogenes. Clusters were then manually curated to ensure that all family members were included (see Methods).
-
aDisparity expresses the copy number in C. dubliniensis subtracted from the number in C. albicans. Cell shading reflects the polarity of evolutionary change, inferred through phylogenetic and comparative analyses (see Methods): C. albicans gain (blue), C. albicans loss (red), C. dubliniensis gain (pink), C. dubliniensis loss (purple), combination of C. albicans gain, and C. dubliniensis loss (light blue). Unshaded cells indicate that the direction of change could not be determined.
-
bY′-related helicases are found in subtelomeric regions in C. dubliniensis; evidence suggests that these are also present in C. albicans and that the apparent disparity in helicase copy number is due to the omission of subtelomeric regions from the C. albicans assembly.


