
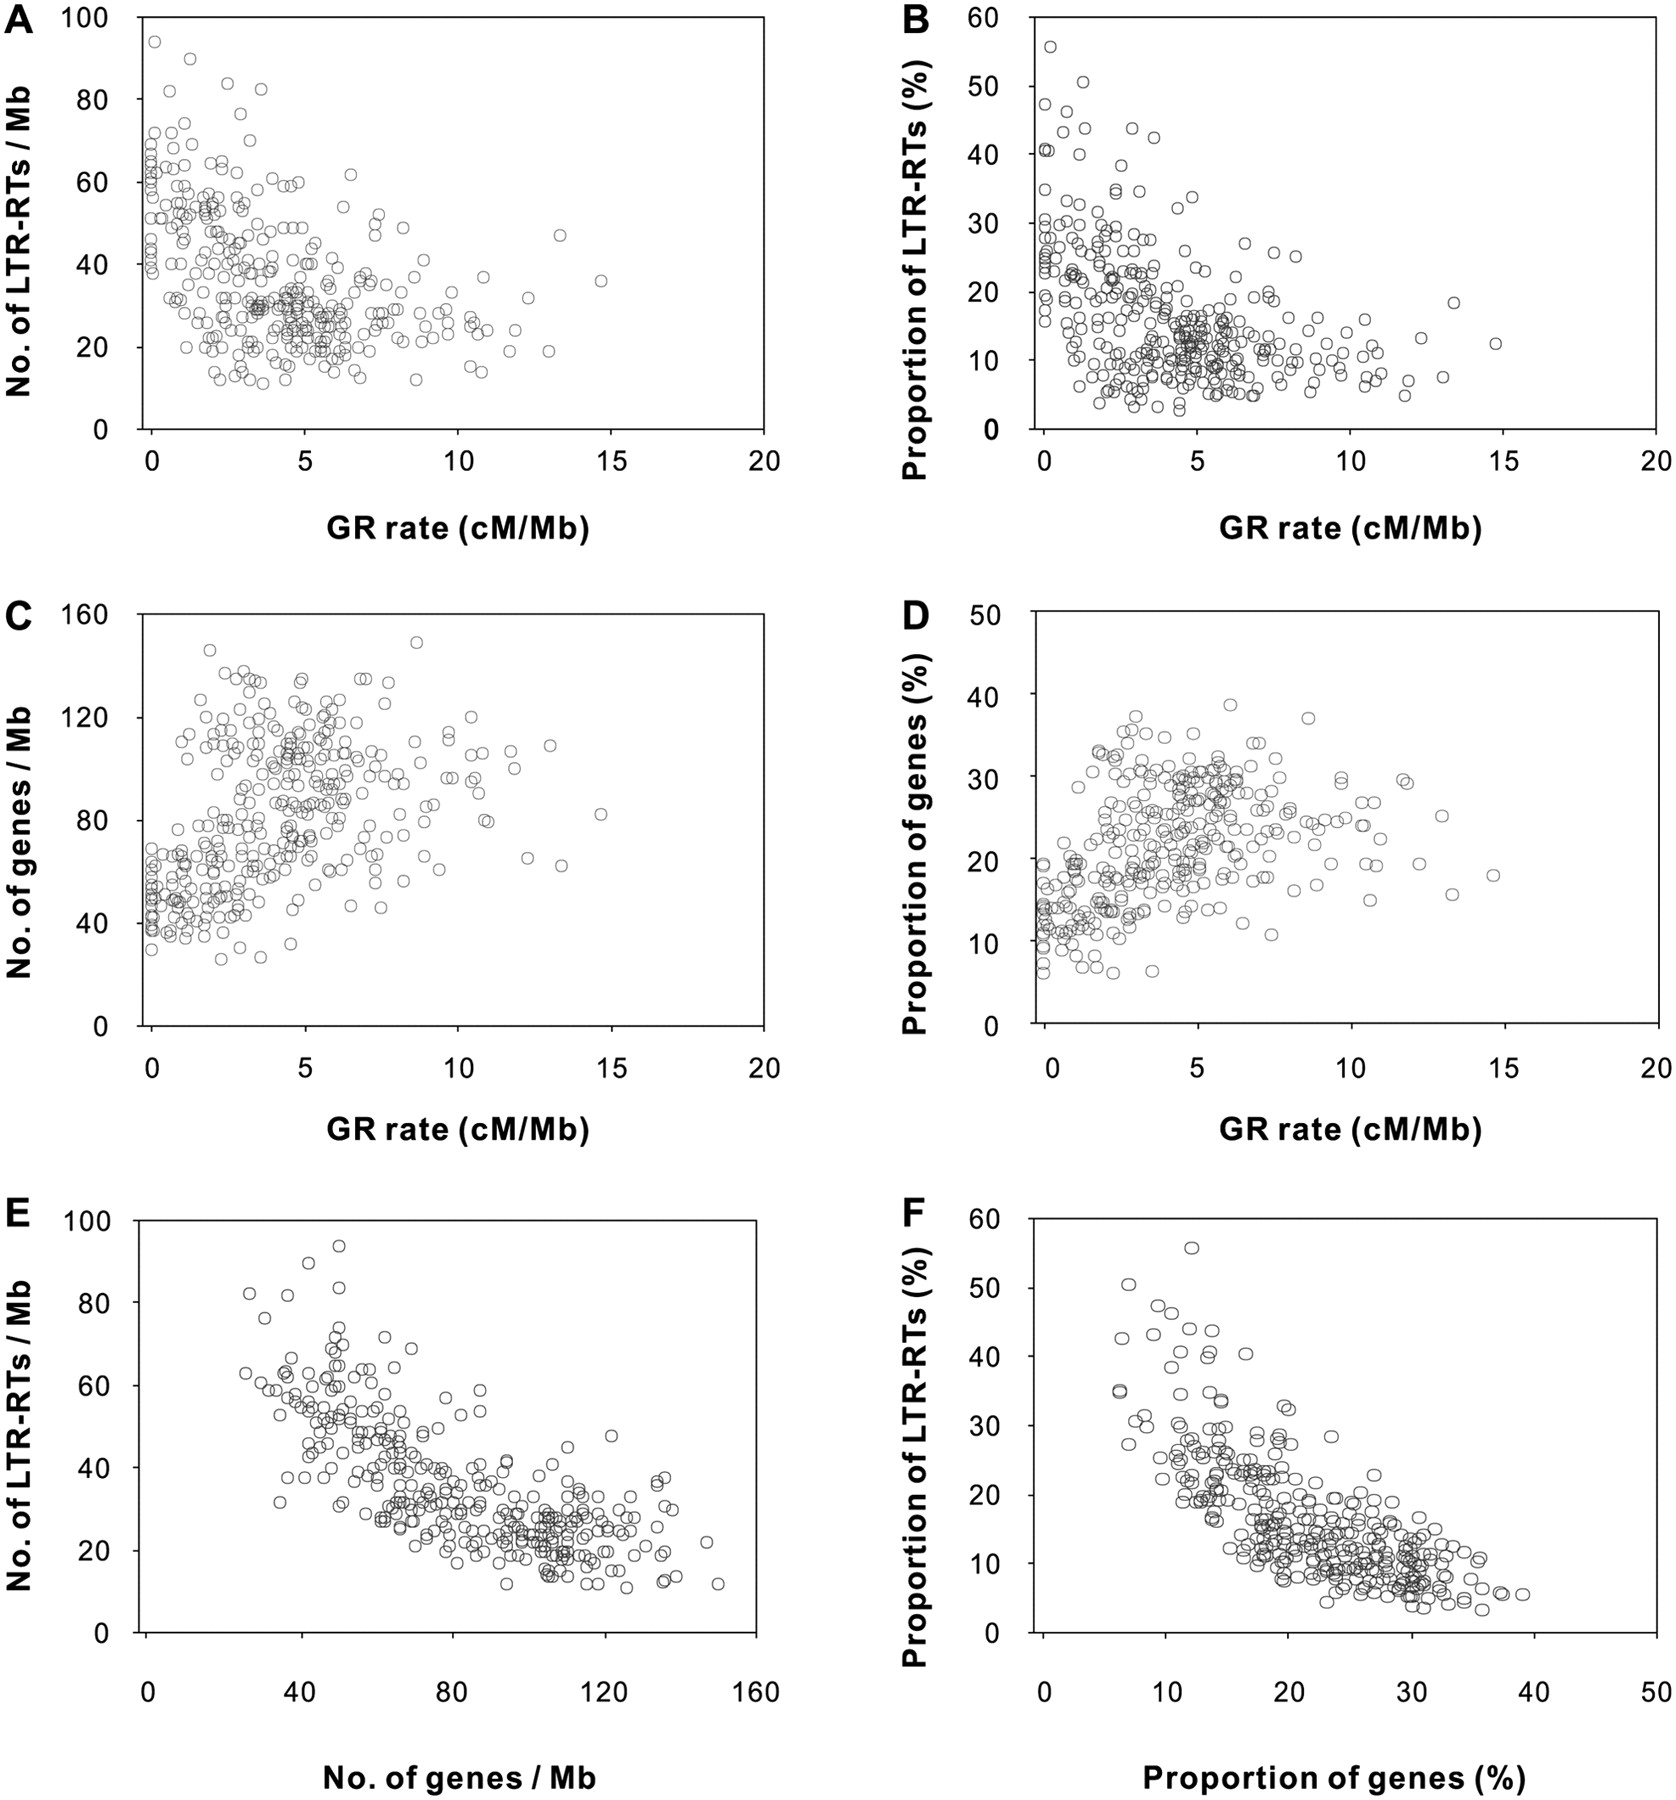
Figure 3.
Correlations of genomic features with GR rates and gene densities. (A,B) LTR-RT densities plotted against GR rates. (C,D) Gene densities plotted against GR rates. (E,F) LTR-RT densities plotted against gene densities.


