
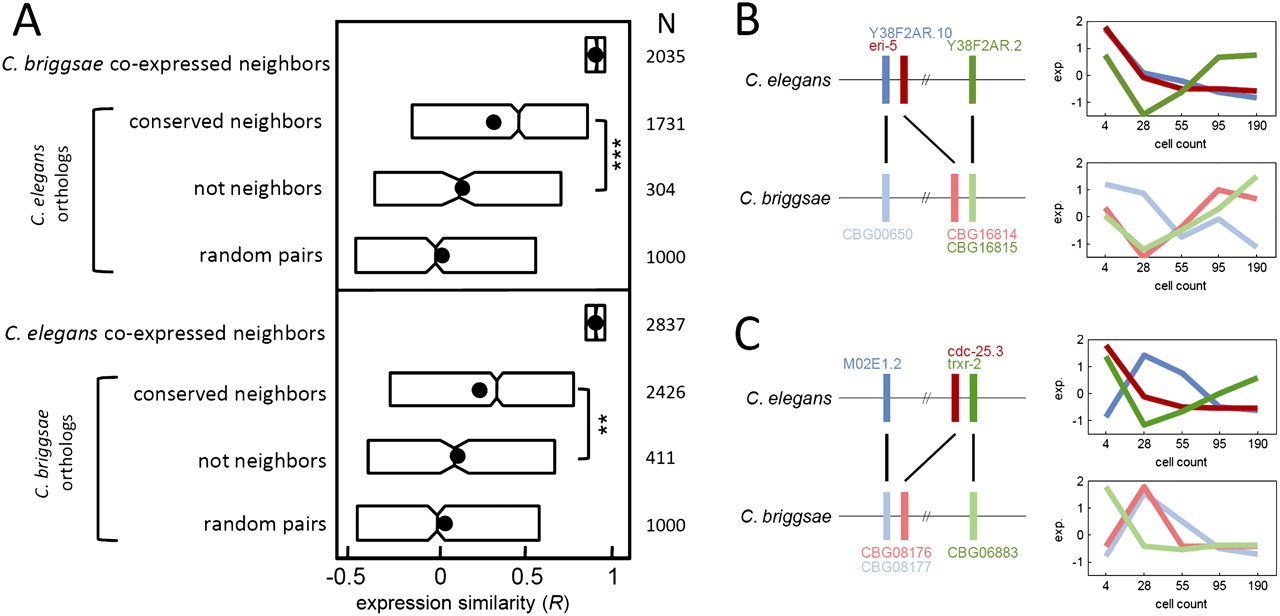
The effect of gene-neighbor conservation on coexpression. (A) Boxplots indicating expression similarity among orthologs of coexpressed gene neighbors. The orthologs were parsed into two sets: Conserved neighbors are those orthologs that are also proximate (within four genes) and non-neighbors are orthologs beyond 100 genes apart. The last group is pairs of genes selected at random. Shown to the right are the number of genes in each category and the associated P-value of the difference among the indicated distributions (***P < 10−6; **P < 10−3, Kolmogorov-Smirnov test). For each set of coexpressed gene neighbors, thresholds for expression were applied (Supplemental Fig. S1) on the starting set, and correlation coefficients were examined for all orthologs. (B,C) The horizontal lines indicate C. elegans and C. briggsae chromosomes, and the vertical bars indicate genes; orthologs are linked by black lines. The expression profile for each gene is shown in the profiles to the right. Additional properties of coexpressed gene neighbors are given in Supplemental Tables S4 and S5.


