
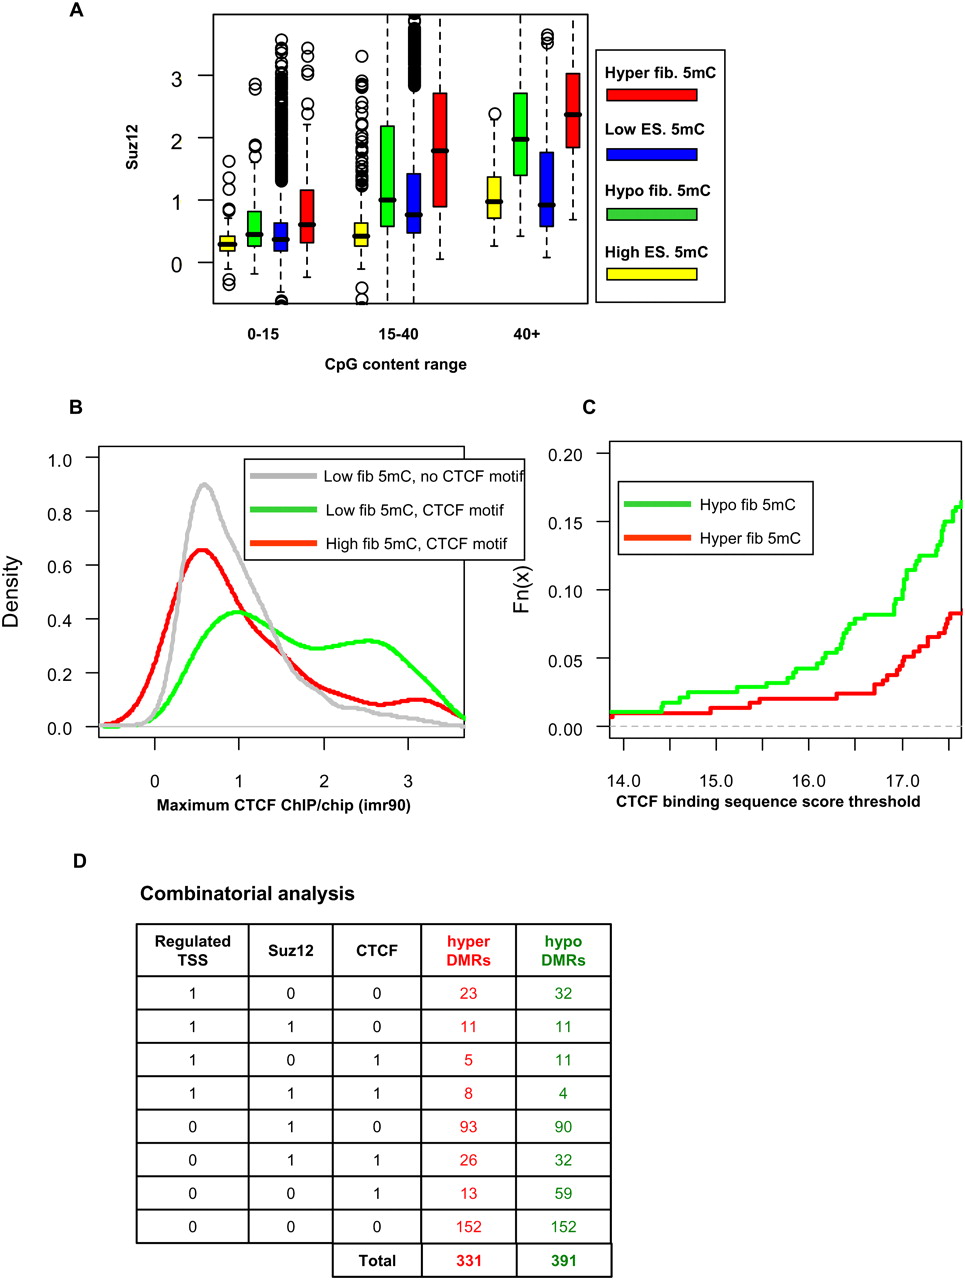
CTCF and Polycomb are correlated with differential methylation. (A) SUZ12 occupancy. Shown are box plots for average human SUZ12 occupancy on mapped monkey DMRs and background regions. We separately plot groups of regions with different levels of CpG content, dissected into (red) hyper-DMRs, (green) hypo-DMRs, (blue) regions with low ES methylation, and (yellow) regions with high ES methylation. In general, regions with high methylation have low SUZ12 levels (e.g., lower than regions with low methylation; see CpG content 15–40). Moreover, regions with higher CpG content (>40) that are hyper- and hypomethylated are enriched in SUZ12 targets. (B) CTCF occupancy at CTCF motifs. Shown are distributions of CTCF binding levels in three groups of genomic loci: (1, gray) background regions lacking CTCF motifs and having low DNA methylation; (2, red) regions of high methylation featuring CTCF binding motifs; (3, green) regions with low DNA methylation featuring CTCF binding motifs. (C) CTCF binding capacity at DMRs. Shown are cumulative probability distributions for the predicted binding energy of the CTCF motif in (red) hyper-DMRs and (green) hypo-DMRs. About 15% of the hypo-DMRs have a strong CTCF binding site, much higher than the percentage for hyper-DMRs. (D) Combinatorial analysis. Shown are counts of DMRs associated with combinations of regulated TSS, SUZ12 hotspot, or CTCF binding site. More than half of the DMRs have at least one factor associated with them.


