
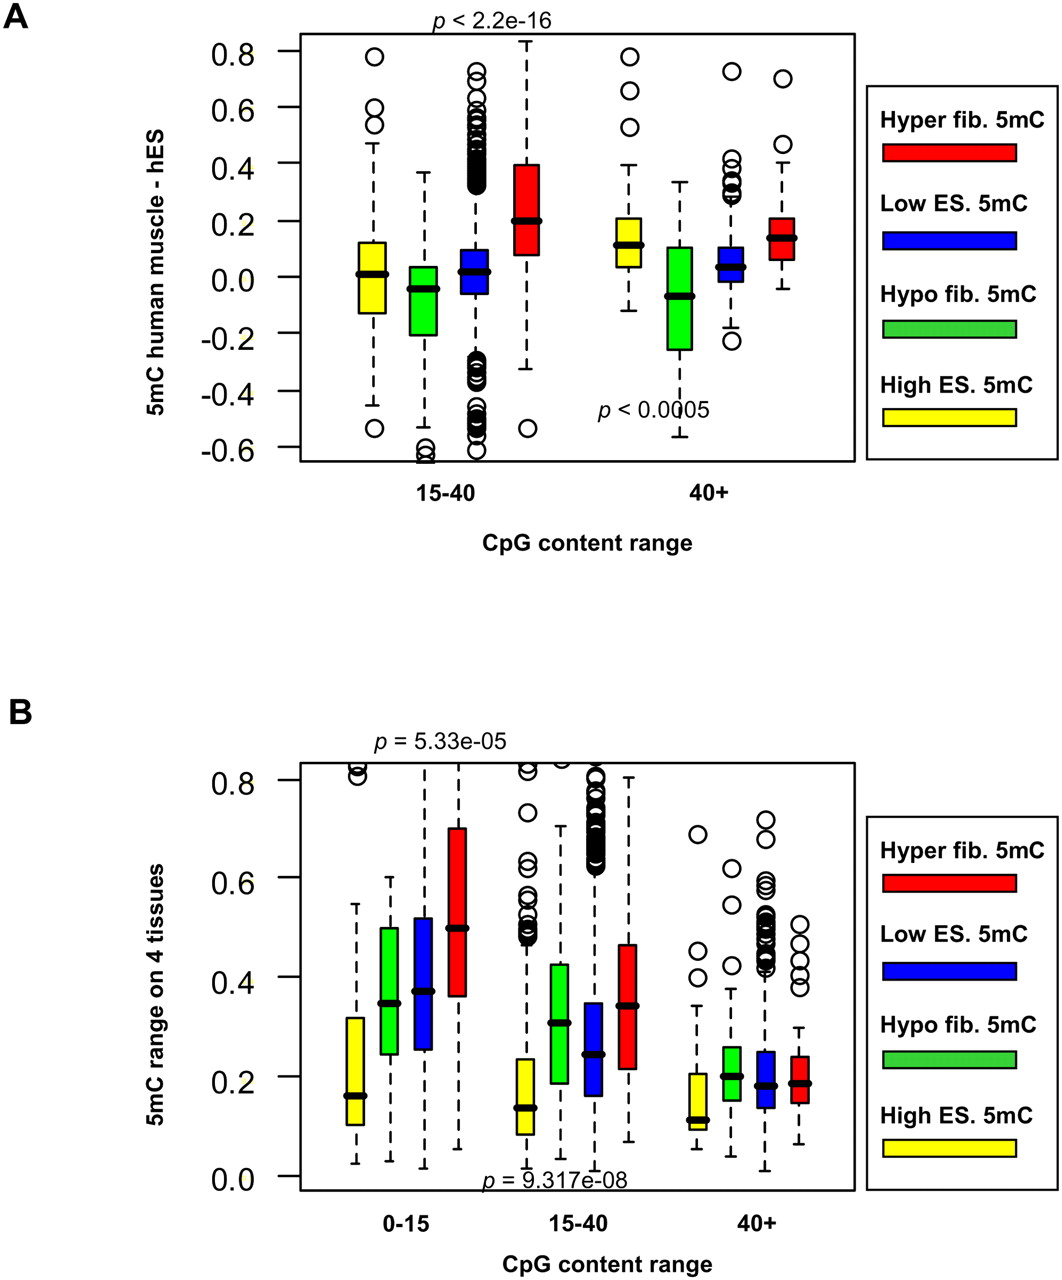
Monkey DMRs are conserved in human ESC and tissues. (A) Muscle-ES differential methylation. Shown are box plots of the DNA methylation differences between human muscle tissues and human ESCs (Straussman et al. 2009), computed for regions of the human genome that are orthologous to monkey (red) hyper- and (green) hypo-DMRs, or to regions with (blue) low or (yellow) high monkey ES methylation. Since the human data span only CpG islands, the statistics only cover regions with intermediate or high CpG content. P-values indicate the significance (using KS test) of difference between hyper-DMRs and low ES methylation regions, and between hypo-DMRs and high ES methylation regions. (B) Range of methylation across a panel of human tissues. Shown are box plots for the differences between the minimum and maximum DNA methylation in human brain, colon, spleen, and liver (Irizarry et al. 2009), for regions that are orthologous to monkey DMRs or regions of high and low monkey ES methylation (same color scheme as in A). P-values indicate the significance of difference between hypo-DMRs and high ES methylation (for CpG range 0–15) and between hyper-DMRs and low ES methylation (for CpG range 15–40).


